TRANGE
What are TRANGES and How to change the report display to see all the solid temperature ranges?
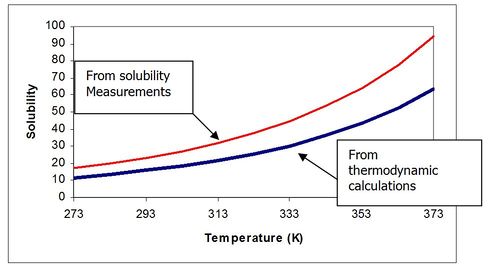
TRANGES are a short and name for Temperature ranges. The equilibrium constants for some solids in the OLI Databases have been fit to a polynomial in temperature rather than determined from pure thermodynamics. Lets consider a hypothetical solid “A”. If we were to plot the solubility of “A” as a function of temperature based on both thermodynamically derived values and from solubility experiments, the plot may look like this:
Figure 1 Solubility Plot
The reason for the difference is that solubility measurements take time and may be kinetically limited. Thermodynamic calculations take values from a variety of sources are may be more stable. It is felt that the solubility measurements more closely represent industrial conditions and the database is adjusted to reflect that feeling.
The solubility data was fit to a polynomial. Polynomials are notorious for not extrapolating correctly. The polynomial used for this purpose is:
Log K = A + B/T + CT + DT2
Incorrect predictions of Scaling Tendency may result outside the fitted temperature range. Therefore the applicable range is generally limited to data set.
For example, consider the solubility of sodium carbonate. There are four possible solids: Na2CO3.10H2O, Na2CO3.7H2O, Na2CO3.H2O and Na2CO3. The solubility temperature limits are: Solid Temperature Range (C) Na2CO3•10H2O 0-35 Na2CO3•7H2O 35-37 Na¬2CO3•1H2O 37-109 Na2CO3 109-350
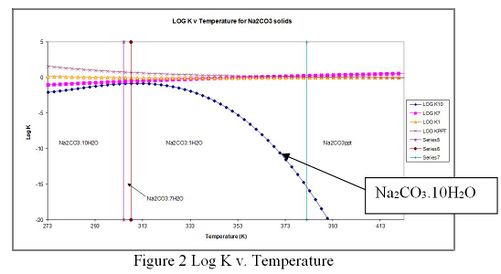
A plot of the log K for each solid is displayed below:
Figure 2 Log K v. Temperature
The temperature range in which each solid is stable is displayed with a vertical line on the plot. For a given solubility of Na2CO3 the lower on the plot, the smaller the Ksp (solubility product) and therefore the higher the scaling tendency. Solids with high scaling tendencies will predict to form. It can be seen that the deca-hydrate species does not extrapolate well to high temperatures. If we concern ourselves with 350K, we can see that if the deca-hydrate was allowed to be in the model, the equilibrium based solver will attempt include it over the actual solid which is the mono-hydrate. Since the deca-hydrate species is outside its temperature range, it will be mathematically eliminated from the equations.
Such solids are frequently shown in ESP with the tag EXCL TR to indicate that the scaling tendency was calculated but not used actively in the software, the solid was Excluded due to Temperature Range issues.
For the OLI Analyzers, this information is also available.
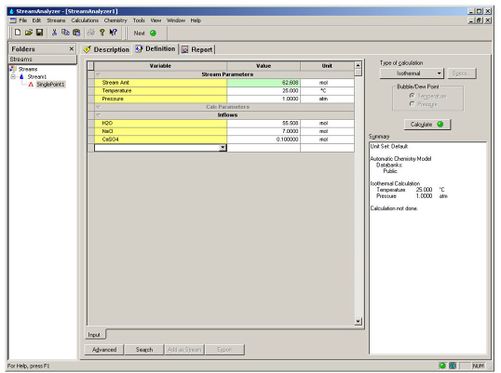
Lets create a simple stream definition. Enter 7 moles of NaCl, 0.1 moles of CaSO4 and 55.508 moles of H2O at 25 C and 1 atmosphere. Perform an isothermal calculation.
Figure 3 Standard Stream Definition
Click on the Report tab and scroll down to the Scaling Tendencies. The default is to display only the solids that may appear at this temperature. The OLI software sometimes limits the applicable range for a solid due to limitation in the available solubility data. This is collectively known as a Temperature Range (TRANGE). Solids that appear outside of the TRANGE are not considered in the calculation.
Figure 4 Standard Scaling Tendency Report
The scaling tendencies for all solids are stored by the StreamAnalyzer. They may be viewed by modifying the report.
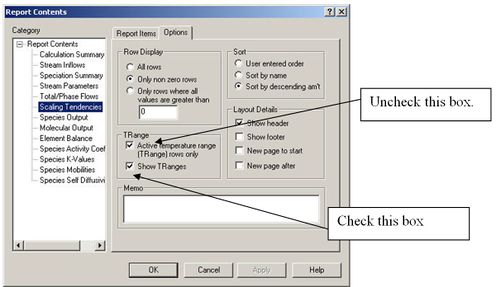
Click on the Customize button. Now highlight Scaling Tendencies and then Click the Options tab.
The only change that needs to be made is to uncheck the Active temperature range (TRange) rows only box and to check the Show Tranges box.
Figure 5 Changing report options
The report will automatically update itself.
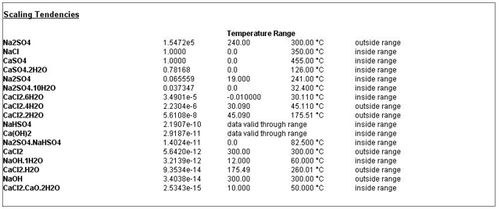
The scaling tendencies are now displayed with the stored temperature ranges. A message is also displayed to inform you if a solid is inside or outside the temperature range. If a solid is applicable over the entire range, it is also noted.
Figure 6 Revised reports
This was OLI Tips01
