Exporting plot data from Analyzer Plots
Contents
Overview
The OLI Analyzers can provide a wealth of information about a chemical system. Sometimes you are interested in only a small portion of the data and do not want to sort through all the output. The plot options can easily reduce the massive amount of data to a smaller, manageable amount. In this guide we will show you a typical procedure to accomplish this task.
Assumptions
This procedure will only work in the OLI Analyzers version 2.0.16 and higher. We also assume that you can start and operate the OLI Analyzers and can plot your desired values.
Example
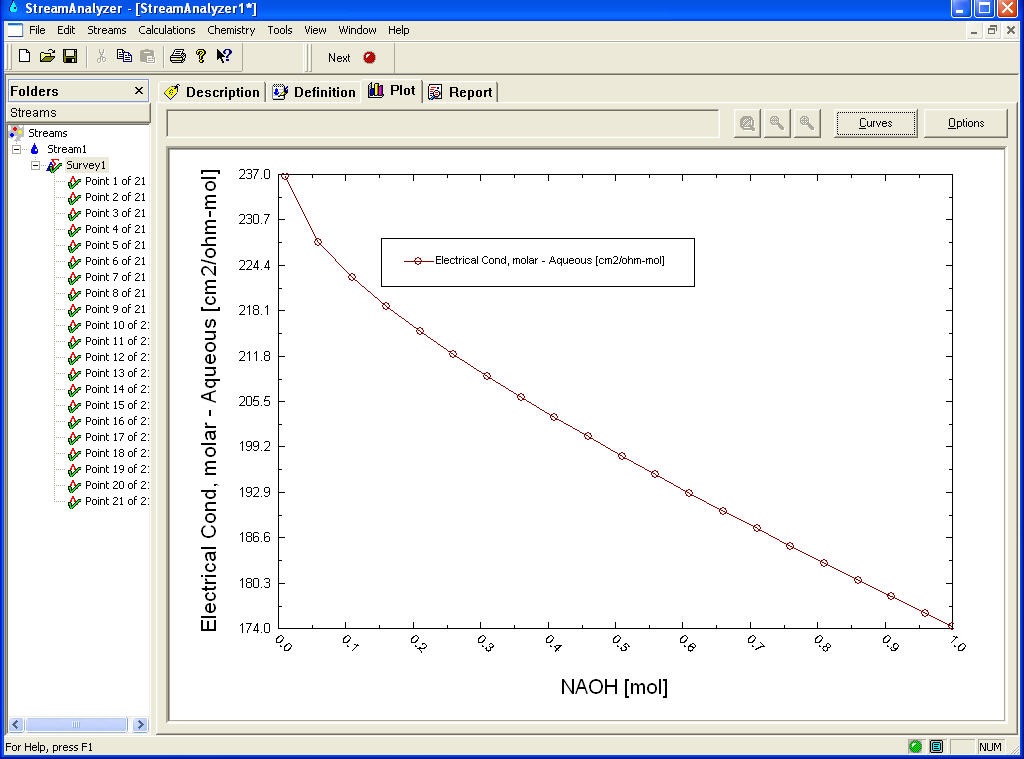
In this example we are plotting the molar electrical conductivity versus the amount of sodium hydroxide in the solution. This technique will work for any plotted variable. You will need to specify the units you want to use since they can not be automatically changed once the data is exported. Also, apply any formatting and title changes you wish at this time.
Figure 1 Standard OLI Analyzers Plot Dialog
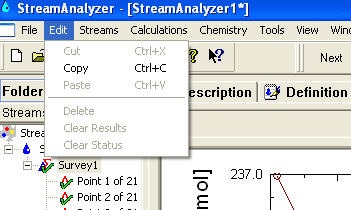
To start the export, select Edit from the menu line.
Figure 2 Select Copy
Next select Copy from the drop-down menu. This will place both the plot (as a bitmap) and the plot data into the windows clip-board.
Start Excel
Next start your spreadsheet program. The example here uses Microsoft Excel 2003.
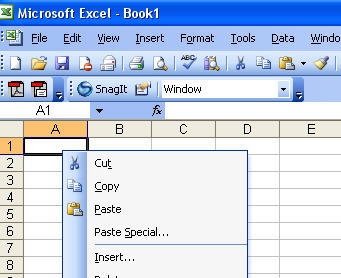
Select Edit from the menu line and then select Paste Special… from the drop-down menu.
Figure 3 Select Edit and then Paste Special
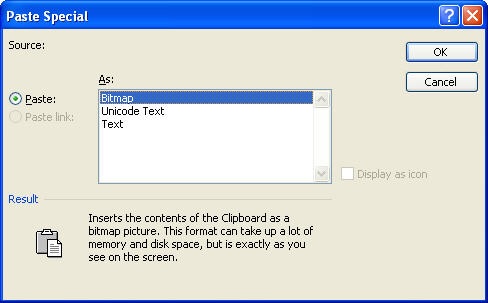
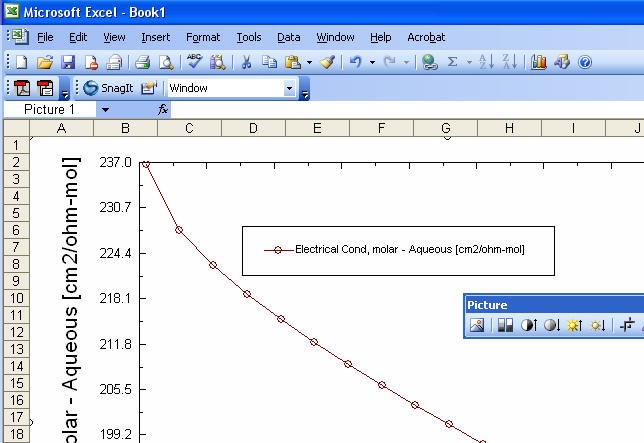
You will have several options. If you want the bitmap image to be in the excel document, select Bitmap.
Figure 4 Selecting Bitmap
Figure 5 The imported image
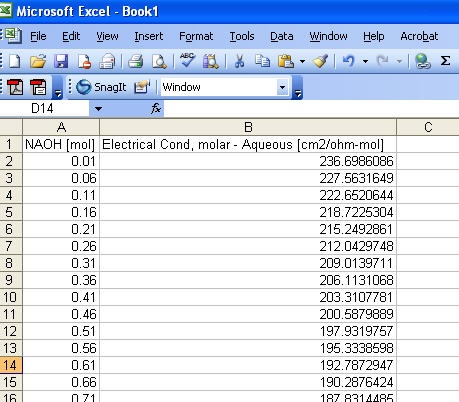
To import the actual data, repeat the Edit/Past Special… procedure above.
Figure 6 the imported data
You may now manage the data within the spreadsheet. Please note, it is not necessary to import the bitmap image if you choose not to.
Exporting the plot to a graphics image file
Supported graphics images
The following file types are supported in the graphics export procedure:
BMP - Bitmapped files JPG - JPEG files PNG - Portable graphic files
