Difference between revisions of "Corrosion FAQ's"
(→When standard database predicts precipitation of Fe(III), Zn(II), Cu(II) as Fe(OH)3, Zn(OH)2 and Cu(OH)2 respectively, Inclusion of the Corrosion database produces the more stable hematite Fe2O3, goethite FeO(OH), ZnO and CuO solids.) |
|||
| (28 intermediate revisions by 2 users not shown) | |||
| Line 1: | Line 1: | ||
| − | + | Frequently Asked Questions about OLI and Corrosion | |
| − | + | == Databanks == | |
| + | [[When standard database predicts precipitation of Fe(III), Zn(II), Cu(II) as Fe(OH)3, Zn(OH)2 and Cu(OH)2 respectively, Inclusion of the Corrosion database produces the more stable hematite Fe2O3, goethite FeO(OH), ZnO and CuO solids]] | ||
| − | == | + | == Phenomena == |
| + | [[Elemental Sulfur Corrosion]] | ||
| − | + | == ISO Corrosion standards == | |
| + | Comparison with ISO15156. | ||
| + | ISO15156 is a standard for corrosion-resistant alloy selection for Oil and Gas production. | ||
| + | |||
| + | The environmental limits for the alloys in ISO15156-3 are based on experimental data with chloride concentration up to 180000 mg/l using NaCl. | ||
| + | |||
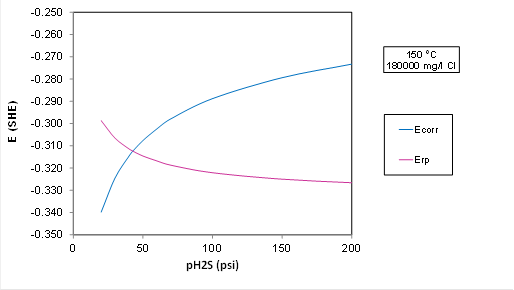
| + | A plot for Ecorr and Erp at 150 C and 5.7 m NaCl (180000 mg Cl/l) with varying partial pressure of H2S: | ||
| + | |||
| + | [[File:ISO.png]] | ||
| + | |||
| + | Plot Analysis: The transition to localized corrosion is predicted at about 50 psi H2S in OLI's predictive model, whereas ISO 15156 predicts that the alloy is OK up to 200 psi H2S. The electrochemical model is more conservative than the standard. But the transition would move to a substantially higher P(H2S) if the chloride concentration is lowered(because Erp strongly depends on Cl). | ||
| + | The driving force for localized corrosion, i.e., the difference between Ecorr and Erp in the plot above is small, i.e., it is only about 50 mV at 200 psi H2S, which is within the experimental uncertainty. | ||
| + | |||
| + | Note: The above mentioned results are still under development at OLI. | ||
| + | |||
| + | [[user:RNIMKAR | Editor: Rasika Nimkar, Author: Andre Anderko]] | ||
| + | [[Category: Corrosion]] | ||
| + | |||
| + | == Pitting Current Density == | ||
| + | |||
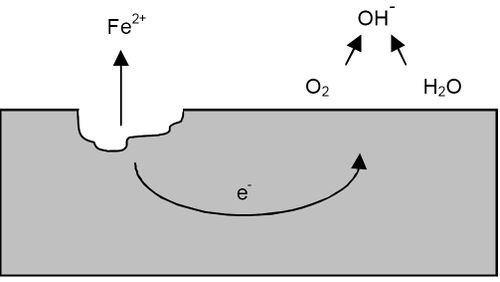
| + | A pitting can be represented by the following diagram: | ||
| + | |||
| + | [[File:2017-05-26 15-28-09.jpg|500px]] | ||
| + | |||
| + | |||
| + | Source:https://en.wikipedia.org/wiki/Pitting_corrosion | ||
| + | |||
| + | |||
| + | OLI's corrosion model predicts the current density as a function of potential which is given by the following equation: | ||
| + | |||
| + | [[File:2017-05-26 15-15-39.jpg]] | ||
| + | |||
| + | The basic idea behind the pitting current density is as follows: | ||
| + | |||
| + | * The repassivation potential model gives an i vs. E relationship within a localized corrosion environment. Since it is a limiting model (i.e., it is rigorous only in the limit of repassivation), it does not include mass transfer effects and does not handle the spatial distribution of current. Therefore, it can be viewed as representing a one-dimensional, maximum propagation rate. | ||
| + | * At the corrosion potential, it will give the maximum propagation rate for one-dimensional propagation of localized corrosion. The corrosion potential is calculated from a general corrosion model (on a passive surface). | ||
| + | |||
| + | |||
| + | [[user:RNIMKAR | Editor: Rasika Nimkar]] | ||
| + | [[Author: Andre Anderko]] | ||
[[Category: Corrosion]] | [[Category: Corrosion]] | ||
Latest revision as of 13:39, 11 January 2018
Frequently Asked Questions about OLI and Corrosion
Databanks
Phenomena
ISO Corrosion standards
Comparison with ISO15156.
ISO15156 is a standard for corrosion-resistant alloy selection for Oil and Gas production.
The environmental limits for the alloys in ISO15156-3 are based on experimental data with chloride concentration up to 180000 mg/l using NaCl.
A plot for Ecorr and Erp at 150 C and 5.7 m NaCl (180000 mg Cl/l) with varying partial pressure of H2S:
Plot Analysis: The transition to localized corrosion is predicted at about 50 psi H2S in OLI's predictive model, whereas ISO 15156 predicts that the alloy is OK up to 200 psi H2S. The electrochemical model is more conservative than the standard. But the transition would move to a substantially higher P(H2S) if the chloride concentration is lowered(because Erp strongly depends on Cl). The driving force for localized corrosion, i.e., the difference between Ecorr and Erp in the plot above is small, i.e., it is only about 50 mV at 200 psi H2S, which is within the experimental uncertainty.
Note: The above mentioned results are still under development at OLI.
Editor: Rasika Nimkar, Author: Andre Anderko
Pitting Current Density
A pitting can be represented by the following diagram:
Source:https://en.wikipedia.org/wiki/Pitting_corrosion
OLI's corrosion model predicts the current density as a function of potential which is given by the following equation:
The basic idea behind the pitting current density is as follows:
- The repassivation potential model gives an i vs. E relationship within a localized corrosion environment. Since it is a limiting model (i.e., it is rigorous only in the limit of repassivation), it does not include mass transfer effects and does not handle the spatial distribution of current. Therefore, it can be viewed as representing a one-dimensional, maximum propagation rate.
- At the corrosion potential, it will give the maximum propagation rate for one-dimensional propagation of localized corrosion. The corrosion potential is calculated from a general corrosion model (on a passive surface).


