How to "Set" the partial pressure of a gas
How do you set the partial pressure of a gas in OLI Studio?
The short is answer is that you cannot.
OK, now for the real answer. You can "Set" the partial pressure of a gas in OLI Studio via a series of calculations to get close to (sometimes very close to) the actual partial pressure that you want.
For this example, we wish to know the solubility of calcite (CaCO3) at 25 °C and 1.0 atmospheres partial pressure of carbon dioxide (PCO2)
With version 9.5.2 of OLI Studio, we have added partial pressures as a variable that you can report and plot (unfortunately not set). We will show you where these are located later on in this tutorial.
We have several methods in which to "set" the partial pressures, the easiest (and fastest) is to pick the value off a plot. Let's start by creating the OLI Studio stream we which to use.
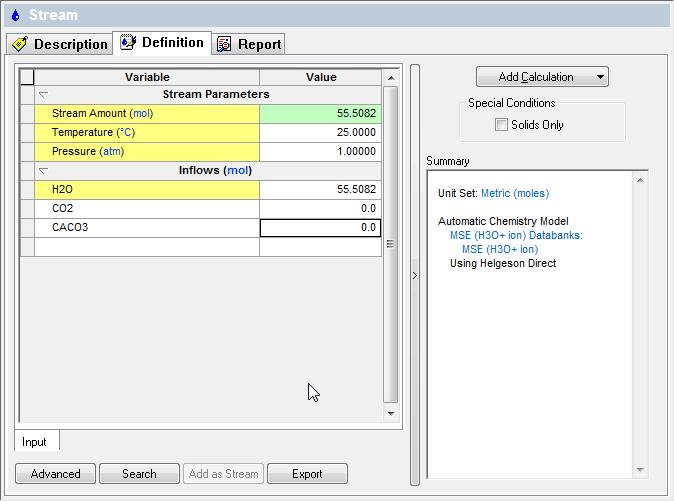
Create an MSE stream with the following components:
So far, so good...
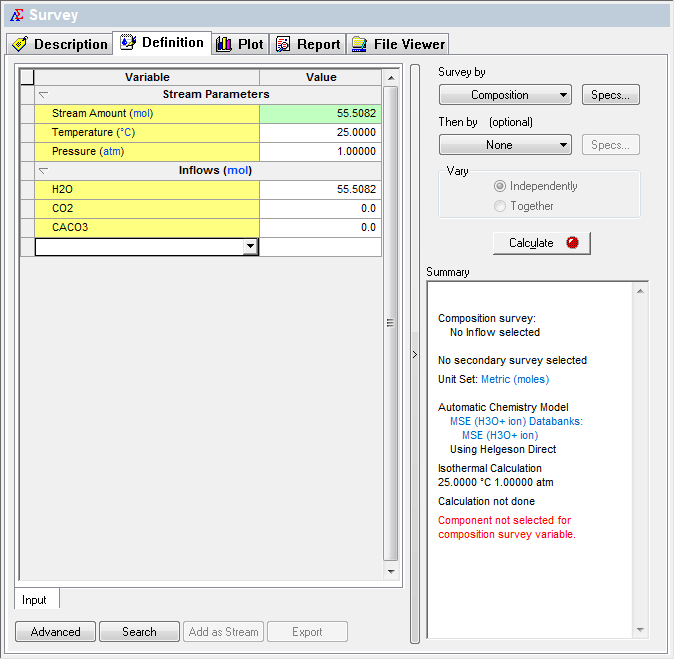
We now need to add a survey. The default survey is temperature, we will change that to composition.
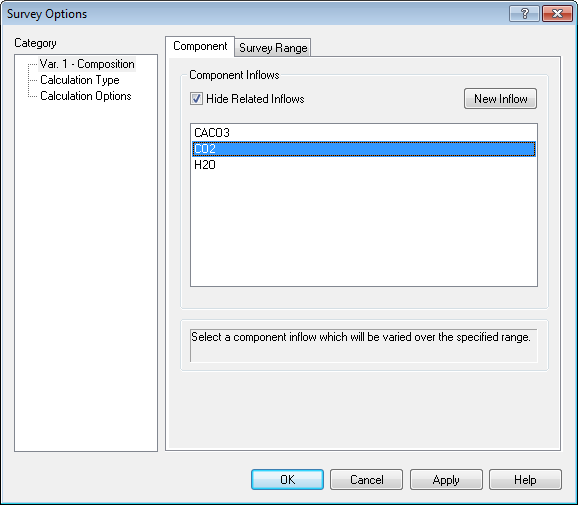
To "set" the partial pressure of CO2 we need to adjust the amount of carbon dioxide we are entering into the survey. Use the Specs... button to set the composition component to CO2
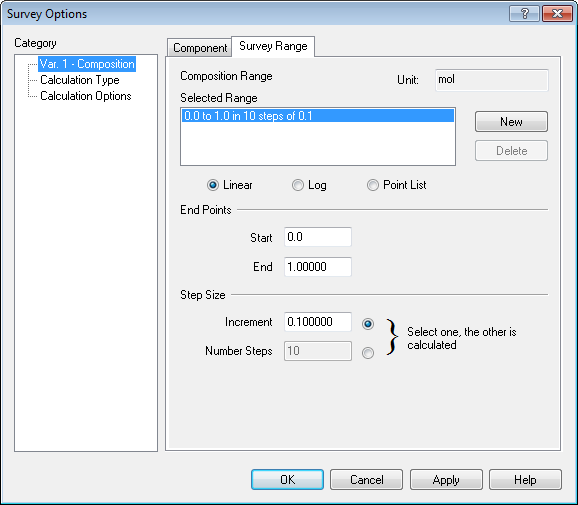
We need a range, let's try a range of 0 to 1 mole in 0.1 mole increments for CO2 (by the way, this is the default range for a composition survey):
If we now run the simulation we will only get a simulation of the solubility of carbon dioxide in water at a constant temperature and pressure. This is not what we want. What we want is a solubility calculation for calcite and to keep the amount of carbon dioxide at a constant partial pressure.
We cannot do this exactly but we can make an approximation. What we will do is use a custom calculation. OLI does not naturally allow you to adjust two or three variables simultaneously in a survey. This can cause some confusion in the calculation. However, we need to do this for this simulation. To do this we need to enable custom calculations in a survey. Please see Enabling custom calculation within survey on how to enable this feature.
So here is the procedure, we need to create a precipitation point which adjusts some inflow - in this case CaCO3 and fixes (sets) a solid - CaCO3PPT. In addition we need to adjust the pressure to force a vapor phase. We do not need a lot of vapor so a bubble point calculation is sufficient. Here we will adjust the pressure (total) to set a total vapor amount (in moles).
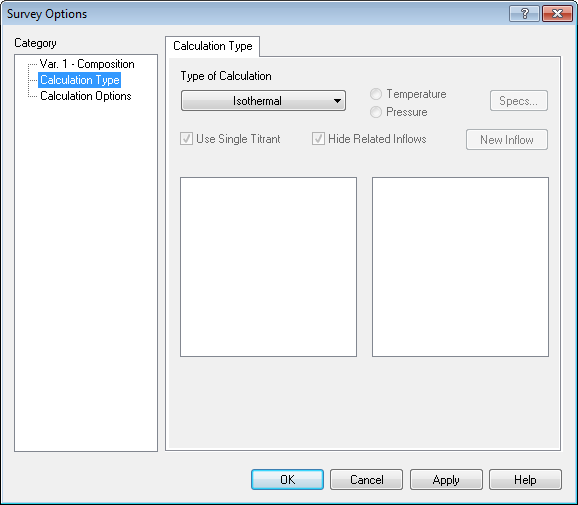
After enabling the features, click the Specs... button once gain. The select Calculation Type
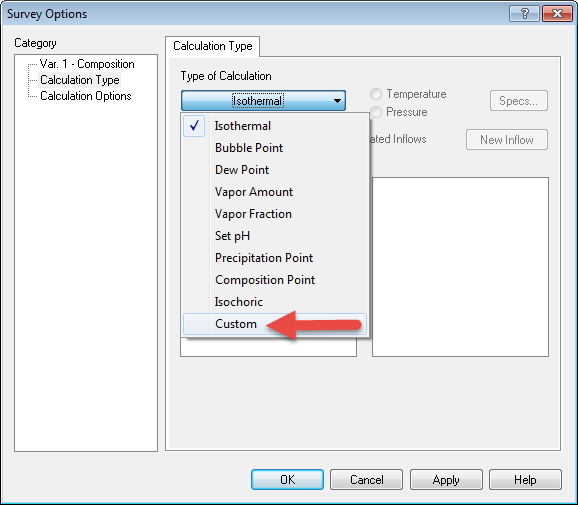
From the Type of Calculation button and select Custom
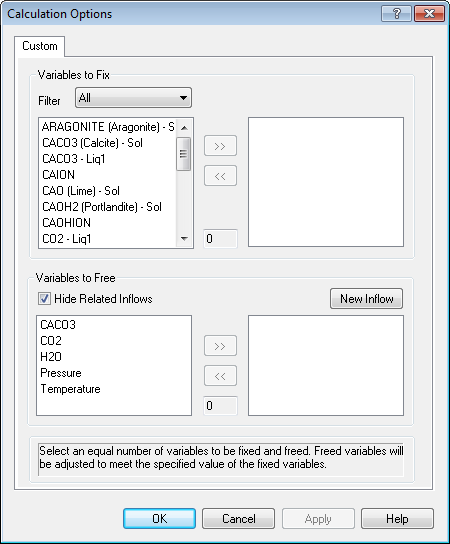
Secondary Specs... button now becomes active. Please select it.
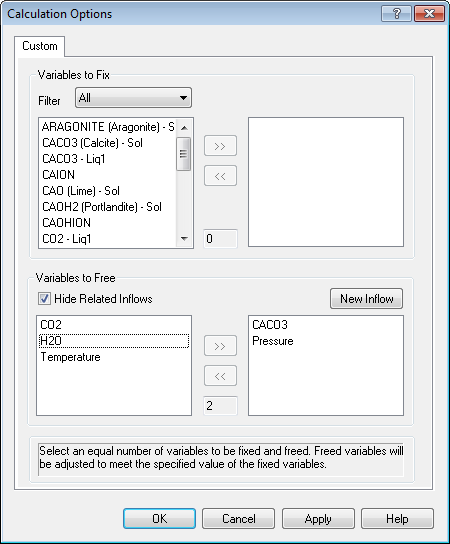
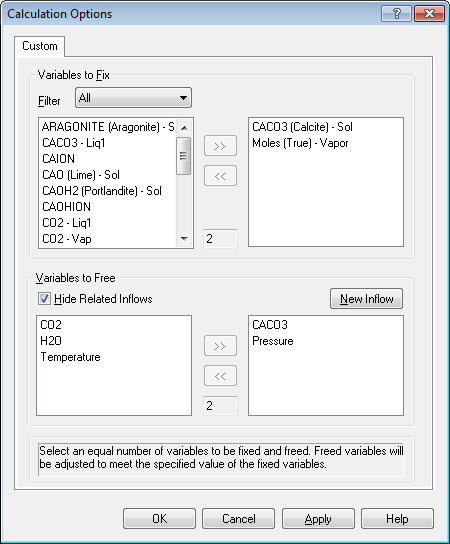
This is a complicated dialog. There is a hard-and-fast rule here that cannot be violated; the number of Free variables must equal the number of free variables. The number in the top section has to be the same as the number in the bottom section.
Let's look at the bottom section first (it's easier to explain). We are going to let the program determine the final values of pressure and inflow values of CACO3. Select both now.
Now we need to find the values to fix in the top section. To do this you must speak "OLI". The variables we need are CACO3 (Calcite) - Sol (this is the amount of CaCO3 solid in moles and Moles (True) - Vapor which is the total vapor moles.
You will notice that the number of fix variables equals the number of free variables. We are adjusting the inflow amount of CaCO3 to match a target amount of solid. This is what we do in a standard precipitation point calculation. You just did it manually. We are also adjusting the pressure to produce a specific amount of vapor. This it essence of a bubble point calculation.
Click OK to accept the values.
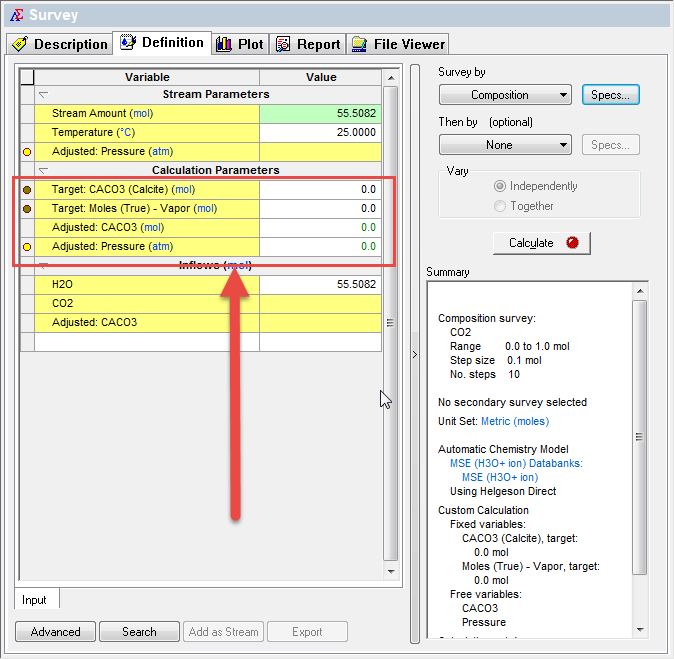
When back on the main Survey grid, we need to specify our set values.
Notice that there are zeroes in the indicated area and that the calculate button is RED indicating we are missing information. We need to set the target values. OLI recommends small values, in the range of 0.000001
The Calculate button is GREEN indicating that the program is ready to go. Click calculate.
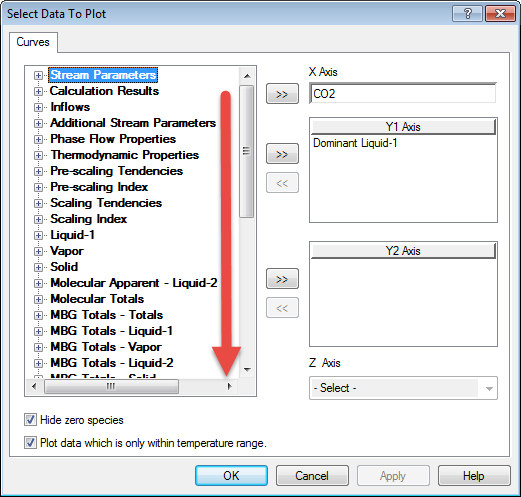
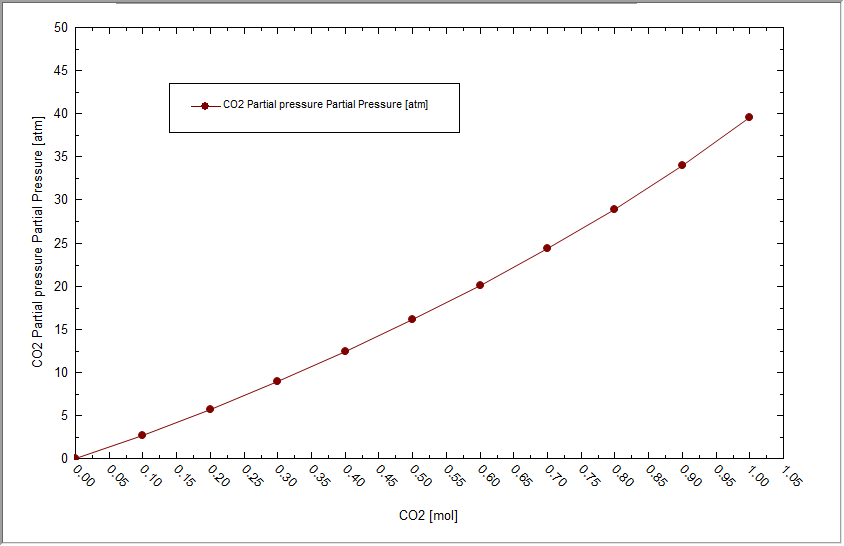
When the calculation is completed please click on the plot tab. The default plot is not of interest to use right now so click the variables button in the upper right-hand corner.
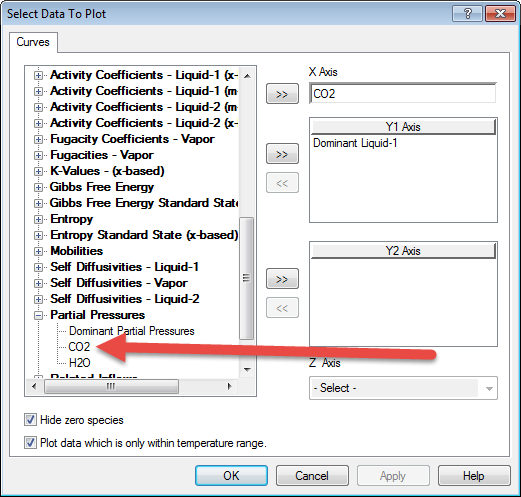
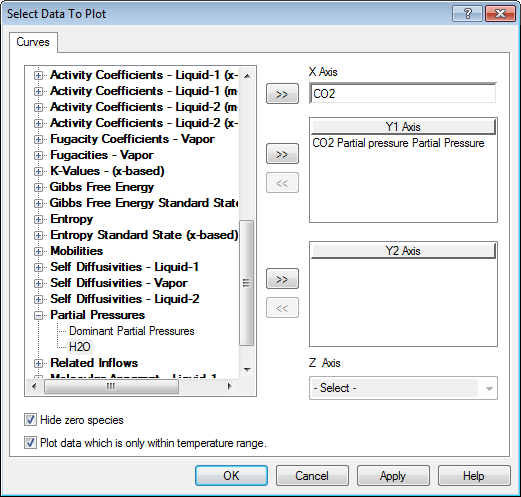
As we mentioned earlier, OLI has added the partial pressure variables to the output and plot portions of the program. To find it on the variables dialog we need to scroll down to Partial Pressures
Select CO2 and remove Dominant Liquid-1
Click OK to return to the plot.
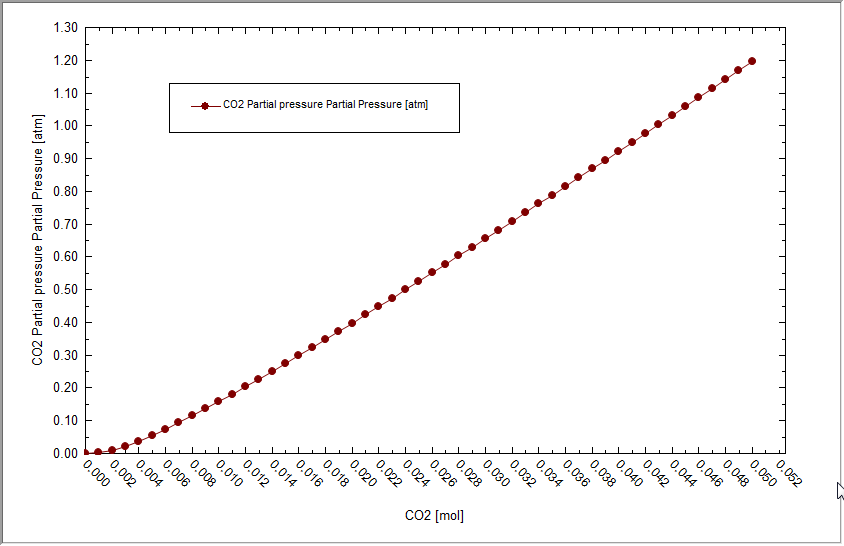
Wow,that is a large partial pressure. We don't need quite as much CO2 as the default range suggested. repeat the calculation with a much smaller range for CO2. For this example we chose a range of 0.0 to 0.05 moles CO2 with an increment of 0.001 moles.
Re-calculate and replot.
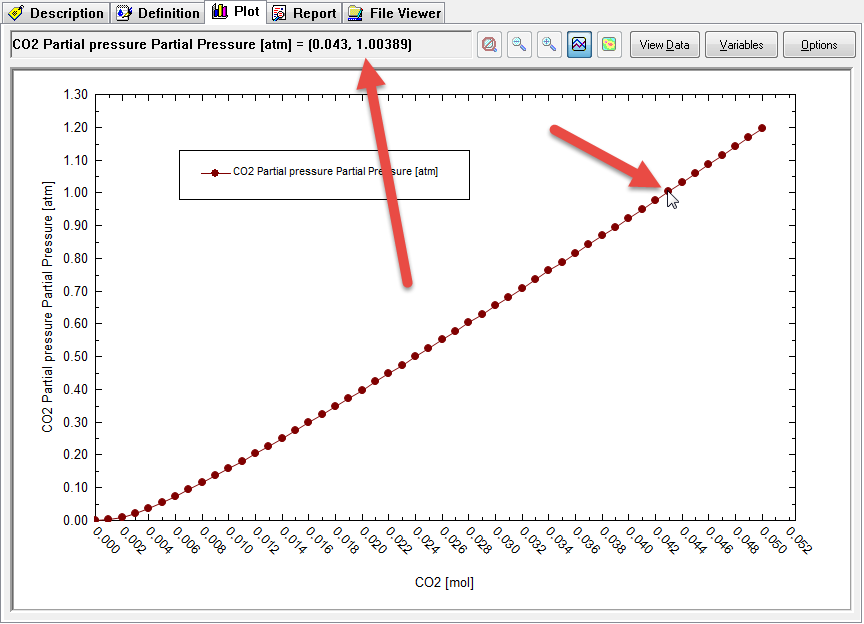
This is a much more reasonable range. Now we need to find the point that is close to 1.0 atmospheres partial pressure. You can use the mouse to hover over each point and the coordinates will be displayed. Here we are close to the 1.0 value.
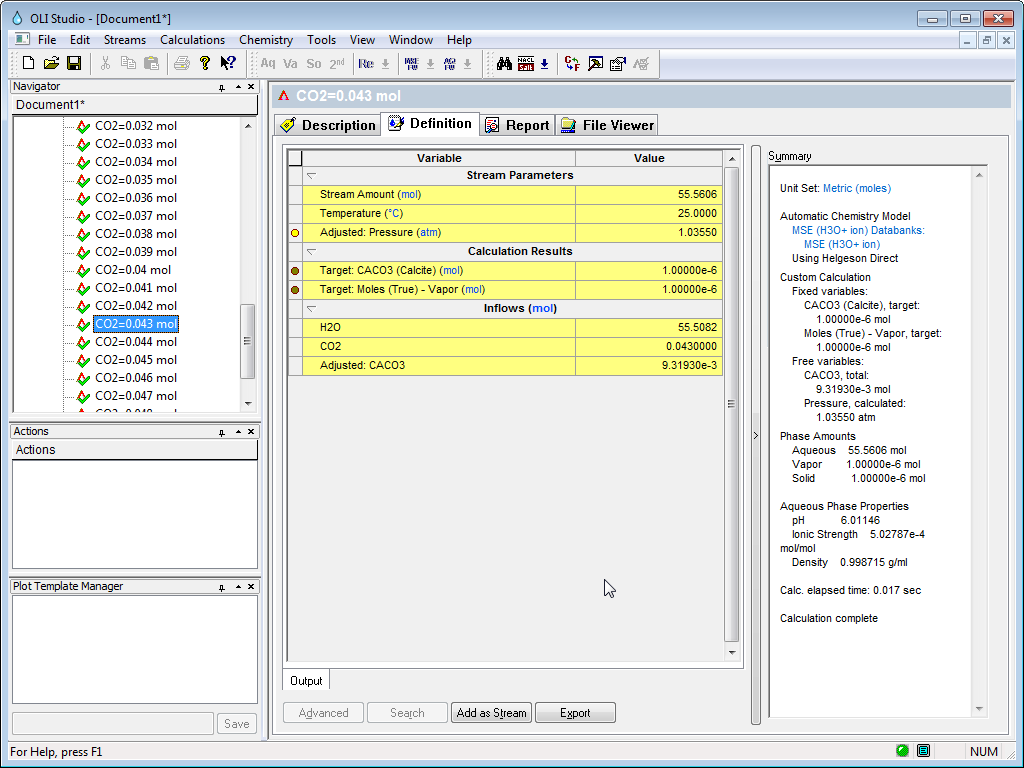
Now we can find the point that corresponds to a PCO2 = 1.0 atmospheres. It seems to be when CO2IN = 0.043. Expand the tree-view in on the left to find 0.043
We can see that the total pressure is 1.0355 atmospheres. The adjusted amount of CaCO3 inflow (this is the solubility) is 0.0093 moles in 1 Kg of H2O.
If you needed to due further calculations at these conditions you use the Add as Stream button to create a new object.
This is one way of creating a set partial pressure for a calculation.
Click here for an example file - version 9.5.3 or later (ZIP, 140 kB)
