Difference between revisions of "Chemical Diagrams"
| Line 7: | Line 7: | ||
To begin we start the OLI Analyzers and select a '''New Stream''' | To begin we start the OLI Analyzers and select a '''New Stream''' | ||
| − | [[File:CD1.png| | + | |
| + | [[File:CD1.png|700px]] | ||
| Line 16: | Line 17: | ||
The inflow amounts of the two precursor species will be set to 0.1 moles each. This keeps the molar ratio 1:1. | The inflow amounts of the two precursor species will be set to 0.1 moles each. This keeps the molar ratio 1:1. | ||
| − | [[File:CD2.png| | + | |
| + | [[File:CD2.png|700px]] | ||
| + | |||
As a side note, you could have also entered the chemical formula names for the species. The formula names are: | As a side note, you could have also entered the chemical formula names for the species. The formula names are: | ||
| + | |||
[[File:CD3.png]] | [[File:CD3.png]] | ||
| + | |||
As you press the enter key or click a new cell, the name changes to the display name. | As you press the enter key or click a new cell, the name changes to the display name. | ||
| Line 26: | Line 31: | ||
After entering the required values, click the '''Add Calculation''' button and select '''Chemical Diagram''' | After entering the required values, click the '''Add Calculation''' button and select '''Chemical Diagram''' | ||
| − | [[File:CD4.png| | + | |
| + | [[File:CD4.png|700px]] | ||
| + | |||
This will display a new object below the stream. Notice that all the stream values have been copied to this new object. | This will display a new object below the stream. Notice that all the stream values have been copied to this new object. | ||
| Line 32: | Line 39: | ||
A chemical diagram requires the user to make some choices. Please click the '''Specs'''... button to start the selection process. | A chemical diagram requires the user to make some choices. Please click the '''Specs'''... button to start the selection process. | ||
| − | [[File:CD5.png| | + | [[File:CD5.png|700px]] |
| + | |||
The initial specification option is the Display Dialog. For this demonstration we only want to display the boundaries between the solid phases and the liquid phases. We do not want to see both the solid phase boundaries and the boundaries between liquid species. Check the next image to see what the diagram looks like with aqueous lines enabled. | The initial specification option is the Display Dialog. For this demonstration we only want to display the boundaries between the solid phases and the liquid phases. We do not want to see both the solid phase boundaries and the boundaries between liquid species. Check the next image to see what the diagram looks like with aqueous lines enabled. | ||
| − | [[File:CD6.png| | + | |
| + | [[File:CD6.png|700px]] | ||
Click the '''No Aqueous Lines''' radio button. Also keep the '''Shade selected subsystem''' button selected. Finally we need to tell the program which chemical subsystem to plot. We can plot more than one but it gets very complicated. Since we are only interested in the lanthanum species, click the '''Lanthanum Check Box'''. Only one subsystem may be selected at a time. | Click the '''No Aqueous Lines''' radio button. Also keep the '''Shade selected subsystem''' button selected. Finally we need to tell the program which chemical subsystem to plot. We can plot more than one but it gets very complicated. Since we are only interested in the lanthanum species, click the '''Lanthanum Check Box'''. Only one subsystem may be selected at a time. | ||
| − | [[File:CD7.png| | + | |
| + | [[File:CD7.png|700px]] | ||
| + | |||
Now click on the Axes category. The dialog changes to display the '''X Axis'''. | Now click on the Axes category. The dialog changes to display the '''X Axis'''. | ||
| Line 50: | Line 61: | ||
Click on the '''Titrants''' button. | Click on the '''Titrants''' button. | ||
| − | [[File:CD8.png| | + | |
| + | [[File:CD8.png|700px]] | ||
| + | |||
The ''Select Titrants'' dialog is displayed. All of the inflows are displayed in both the Acid and Base selections. The reason that this occurs is that at this point in time the OLI Analyzer does not know if the species listed will act as an acid or a base. While it is true that nitric acid always acts as an acid, the same can not be said of weak acids such as many organic acids. | The ''Select Titrants'' dialog is displayed. All of the inflows are displayed in both the Acid and Base selections. The reason that this occurs is that at this point in time the OLI Analyzer does not know if the species listed will act as an acid or a base. While it is true that nitric acid always acts as an acid, the same can not be said of weak acids such as many organic acids. | ||
| Line 58: | Line 71: | ||
Select nitric acid in the '''Acid''' column and sodium hydroxide in the '''Base''' column. | Select nitric acid in the '''Acid''' column and sodium hydroxide in the '''Base''' column. | ||
| − | [[File:CD9.png| | + | |
| + | [[File:CD9.png|700px]] | ||
| + | |||
Click the '''OK''' button to close the dialog. We now have to decide on the pH range to cover. The default is 0 to 14. This is acceptable for this demonstration. | Click the '''OK''' button to close the dialog. We now have to decide on the pH range to cover. The default is 0 to 14. This is acceptable for this demonstration. | ||
| − | [[File:CD10.png| | + | |
| + | [[File:CD10.png|700px]] | ||
| + | |||
We are now ready to specify the Y axis. Click the Y Axis tab. | We are now ready to specify the Y axis. Click the Y Axis tab. | ||
| − | [[File:CD11.png| | + | |
| + | [[File:CD11.png|700px]] | ||
| + | |||
We will be adjusting the inflow species lanthanum acetate - La(C2H3O2)3 and potassium phosphate - K3PO4. | We will be adjusting the inflow species lanthanum acetate - La(C2H3O2)3 and potassium phosphate - K3PO4. | ||
| Line 74: | Line 93: | ||
Scroll down and check the box next to lanthanum(III) acetate - or La(C2H3O2)3 | Scroll down and check the box next to lanthanum(III) acetate - or La(C2H3O2)3 | ||
| + | |||
[[File:CD12.png]] | [[File:CD12.png]] | ||
| + | |||
Find potassium phosphate - K3PO4 and check that box. | Find potassium phosphate - K3PO4 and check that box. | ||
| Line 82: | Line 103: | ||
The calculation is now ready to start. Click the '''Calculate''' button. | The calculation is now ready to start. Click the '''Calculate''' button. | ||
| + | |||
[[File:Cd12 5.png]] | [[File:Cd12 5.png]] | ||
| + | |||
As the program runs, a small progress window is displayed. The status of the calculation is displayed - here the status is "Generating the Chemistry Model". You can cancel the calculation if you need to. | As the program runs, a small progress window is displayed. The status of the calculation is displayed - here the status is "Generating the Chemistry Model". You can cancel the calculation if you need to. | ||
| + | |||
[[File:CD13.png]] | [[File:CD13.png]] | ||
| + | |||
When the calculation is complete, click the Chemical Diagram tab. | When the calculation is complete, click the Chemical Diagram tab. | ||
| + | |||
[[File:CD14.png]] | [[File:CD14.png]] | ||
| + | |||
This displays the Species - pH diagram for this calculation. | This displays the Species - pH diagram for this calculation. | ||
| − | [[File:CD15.png| | + | |
| + | [[File:CD15.png|700px]] | ||
| + | |||
| + | |||
This diagram is very similar to the diagram in the above paper. It does different slightly since the author of the paper made some changes to the chemistry model that is not reflected here. | This diagram is very similar to the diagram in the above paper. It does different slightly since the author of the paper made some changes to the chemistry model that is not reflected here. | ||
We can change the ratio of the precursor species very easily. For the second example we will use the same calculation except we will be adding 5 % more to the lanthanum acetate species. To do this click back on the '''Definition tab''' and change the inflow amount for lanthanum acetate from 0.1000 to 0.1500. | We can change the ratio of the precursor species very easily. For the second example we will use the same calculation except we will be adding 5 % more to the lanthanum acetate species. To do this click back on the '''Definition tab''' and change the inflow amount for lanthanum acetate from 0.1000 to 0.1500. | ||
| + | |||
[[File:CD16.png]] | [[File:CD16.png]] | ||
| + | |||
Re-Calculate and then click on the '''Chemical Diagram''' tab again. | Re-Calculate and then click on the '''Chemical Diagram''' tab again. | ||
| Line 107: | Line 139: | ||
Notice that the diagram is essentially the same. The Y axis label has changed to reflect the increased amount of the lanthanum acetate. | Notice that the diagram is essentially the same. The Y axis label has changed to reflect the increased amount of the lanthanum acetate. | ||
| − | [[File:CD17.png| | + | |
| + | [[File:CD17.png|700px]] | ||
| + | |||
We can also run at different temperatures quite easily. Return to the Definition tab and change the temperature to 200 oC and 25 atmospheres. We have also reset the Lanthanum Acetate value back to 0.1 moles. | We can also run at different temperatures quite easily. Return to the Definition tab and change the temperature to 200 oC and 25 atmospheres. We have also reset the Lanthanum Acetate value back to 0.1 moles. | ||
| − | [[File:CD18.png| | + | |
| + | [[File:CD18.png|700px]] | ||
| + | |||
Re-calculate and then click on the '''Chemical Diagrams''' tab. You can see that the diagram is significantly different reflecting the change in solubility with respect to temperature. | Re-calculate and then click on the '''Chemical Diagrams''' tab. You can see that the diagram is significantly different reflecting the change in solubility with respect to temperature. | ||
| − | [[File:CD19.png| | + | |
| + | [[File:CD19.png|700px]] | ||
| + | |||
This concludes the demonstration. | This concludes the demonstration. | ||
| + | |||
| + | [[Category: Corrosion]] | ||
Revision as of 14:32, 19 November 2014
The OLI Analyzers have a feature that is seldom used which allows for a user to create a stability map for species based on concentration and other parameters such as pH. A contour map is created showing the user where some solids are stable and where others are not.
For this example we are reproducing work found in a paper that was published in Materials Research Innovations, Volume 14, Number 1, February 1010 pp 9-15 by T. Andelman, M.C. Tan, and R.E. Riman.
Specifically we are going to investigate the stability fields where lanthanum acetate - La(C2H3O2)3 and potassium phosphate - K3PO4 are precursors to the plot.
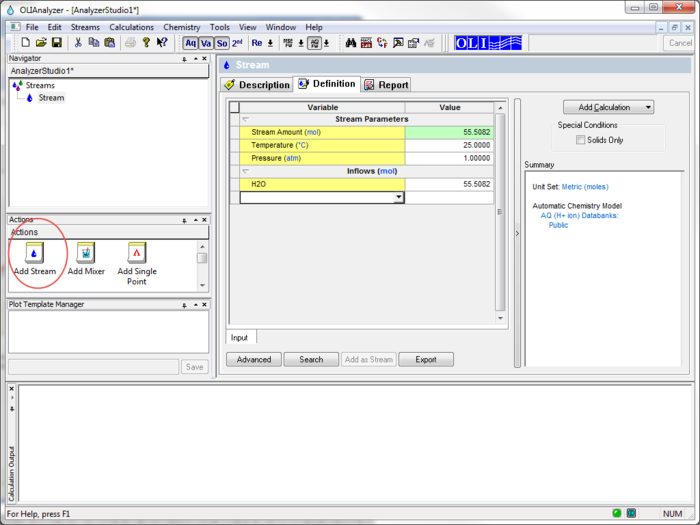
To begin we start the OLI Analyzers and select a New Stream
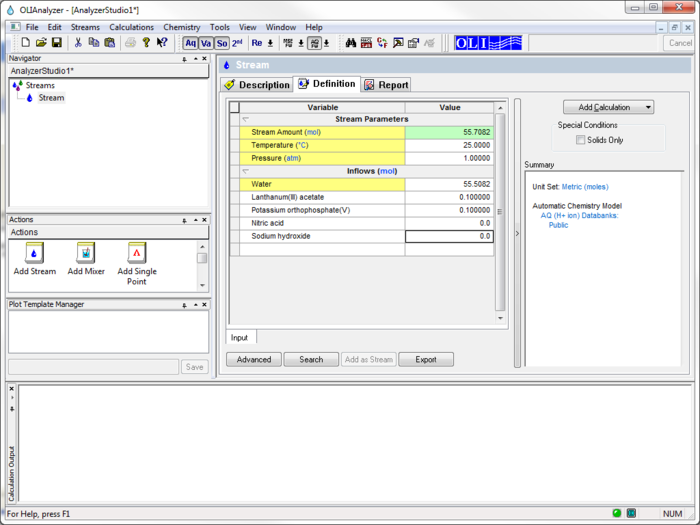
For the moment we are using the display name for the species. Enter the names Lanthanum(III) acetate, Potassium orthophosphate(V), Nitric Acid, and Sodium Hydroxide.
The initial temperature and pressure will be the default values of 25 oC and 1 atmosphere. We will also use the default value for water of 55.5087 moles (which is 1 Kg)
The inflow amounts of the two precursor species will be set to 0.1 moles each. This keeps the molar ratio 1:1.
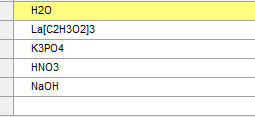
As a side note, you could have also entered the chemical formula names for the species. The formula names are:
As you press the enter key or click a new cell, the name changes to the display name.
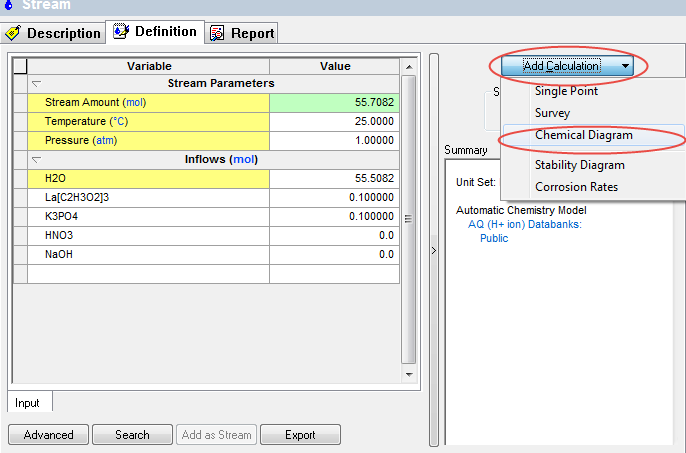
After entering the required values, click the Add Calculation button and select Chemical Diagram
This will display a new object below the stream. Notice that all the stream values have been copied to this new object.
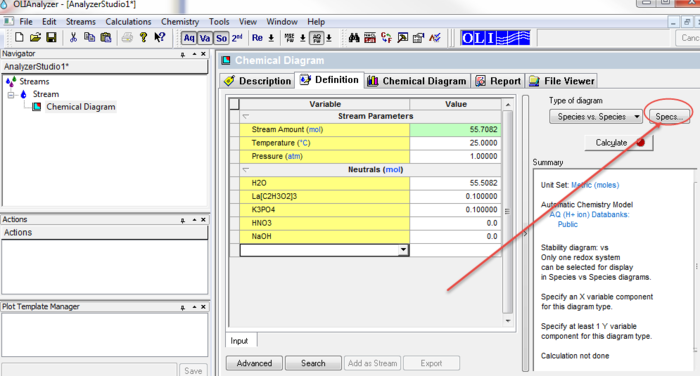
A chemical diagram requires the user to make some choices. Please click the Specs... button to start the selection process.
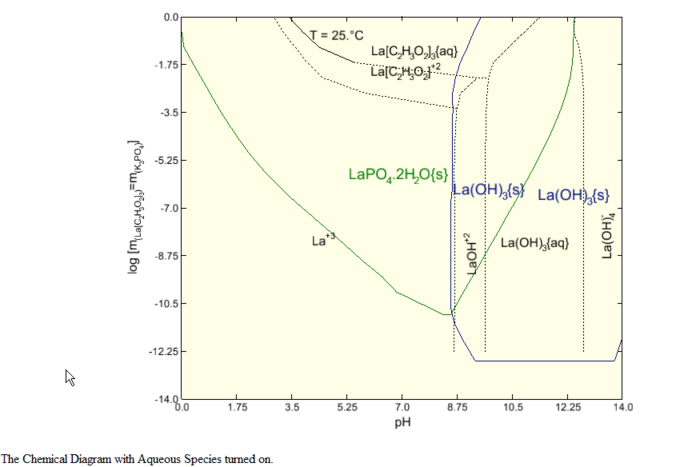
The initial specification option is the Display Dialog. For this demonstration we only want to display the boundaries between the solid phases and the liquid phases. We do not want to see both the solid phase boundaries and the boundaries between liquid species. Check the next image to see what the diagram looks like with aqueous lines enabled.
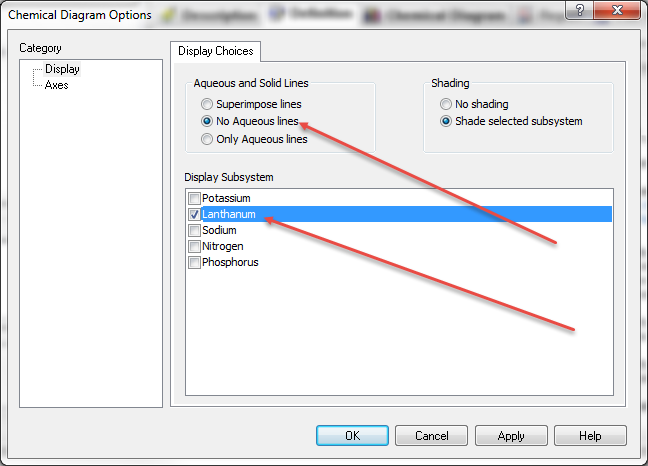
Click the No Aqueous Lines radio button. Also keep the Shade selected subsystem button selected. Finally we need to tell the program which chemical subsystem to plot. We can plot more than one but it gets very complicated. Since we are only interested in the lanthanum species, click the Lanthanum Check Box. Only one subsystem may be selected at a time.
Now click on the Axes category. The dialog changes to display the X Axis.
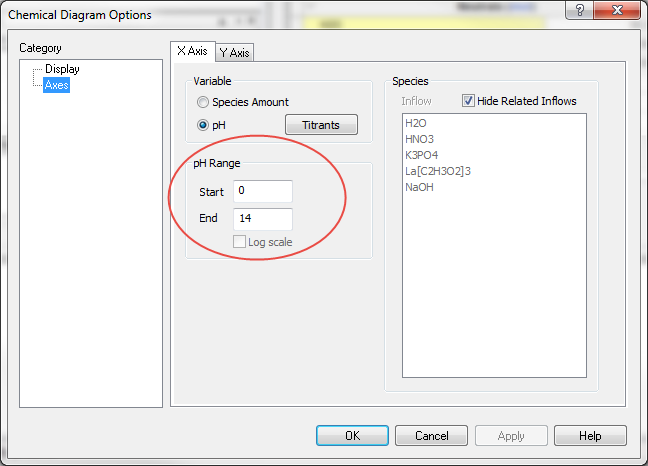
To reproduce the diagram in the above paper, we need to change the X axis to be based on pH. Click the pH radio button.
When pH is selected, we need to choose our titrants. We previously entered nitric acid and sodium hydroxide. We now need to tell the program to use these species.
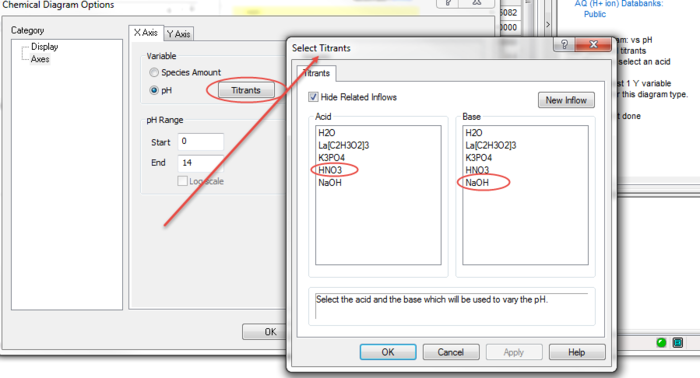
Click on the Titrants button.
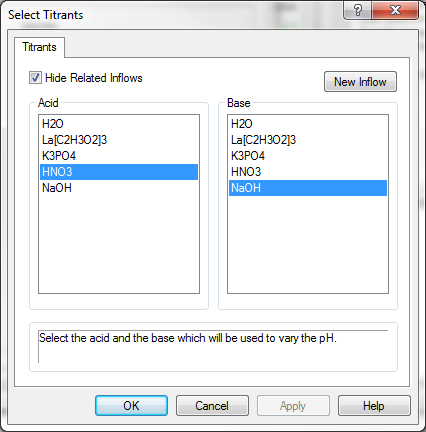
The Select Titrants dialog is displayed. All of the inflows are displayed in both the Acid and Base selections. The reason that this occurs is that at this point in time the OLI Analyzer does not know if the species listed will act as an acid or a base. While it is true that nitric acid always acts as an acid, the same can not be said of weak acids such as many organic acids.
Weak acids function like an acid when the concentration results in pH's less than the pKa of the acid. Conversely, weak acids function like a base when the pH is greater than the pKa. Thus, we display all the available species in both columns since we don't know the solution pH.
Select nitric acid in the Acid column and sodium hydroxide in the Base column.
Click the OK button to close the dialog. We now have to decide on the pH range to cover. The default is 0 to 14. This is acceptable for this demonstration.
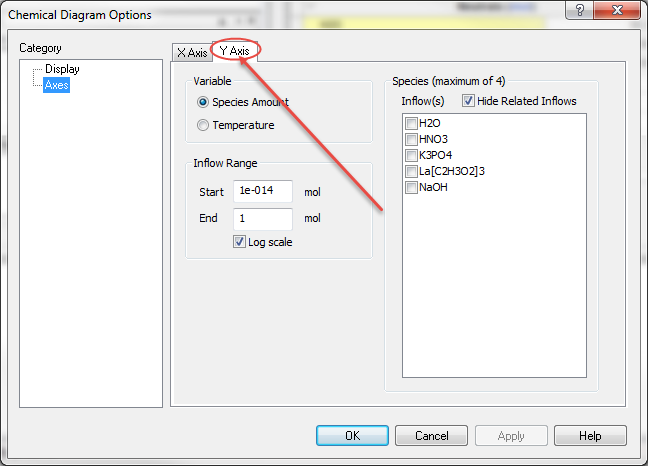
We are now ready to specify the Y axis. Click the Y Axis tab.
We will be adjusting the inflow species lanthanum acetate - La(C2H3O2)3 and potassium phosphate - K3PO4.
Since we specified the initial concentrations at 0.1 moles each, the ratio of the species will be 1:1. We must now select this species from the scroll box. We are keeping the default concentration range from 1E-14 to 1.0 moles on a log scale. This means we will have initially 1.0E-14 moles of La(C2H3O2)3 and 1.0E-14 moles of K3PO4 increasing equally until we have 1.0 moles of each.
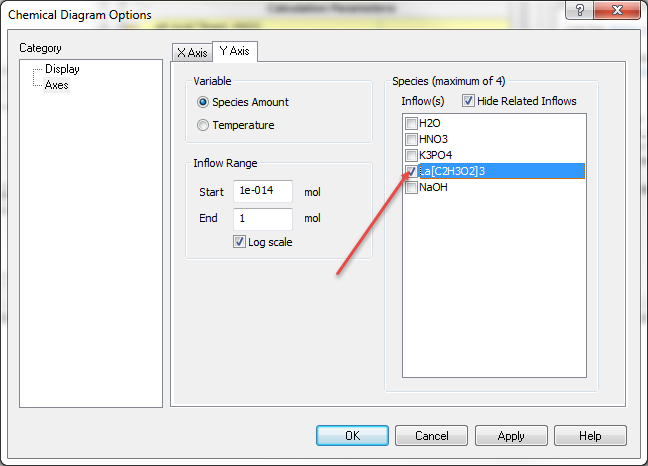
Scroll down and check the box next to lanthanum(III) acetate - or La(C2H3O2)3
Find potassium phosphate - K3PO4 and check that box.
We are now done, click the OK button to exit the Specifications for this calculation.
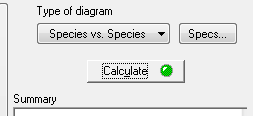
The calculation is now ready to start. Click the Calculate button.
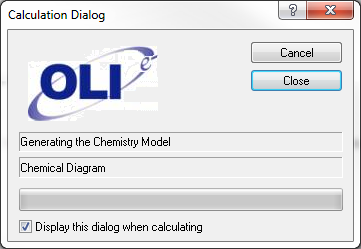
As the program runs, a small progress window is displayed. The status of the calculation is displayed - here the status is "Generating the Chemistry Model". You can cancel the calculation if you need to.
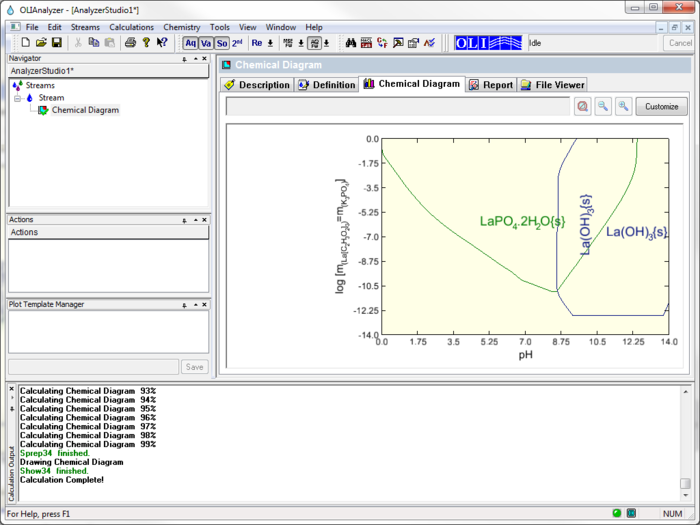
When the calculation is complete, click the Chemical Diagram tab.
This displays the Species - pH diagram for this calculation.
This diagram is very similar to the diagram in the above paper. It does different slightly since the author of the paper made some changes to the chemistry model that is not reflected here.
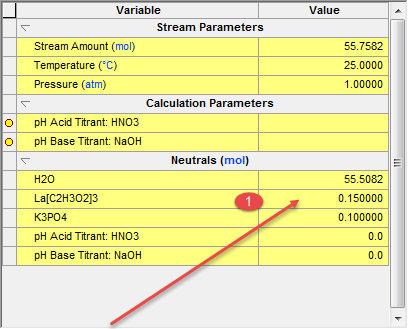
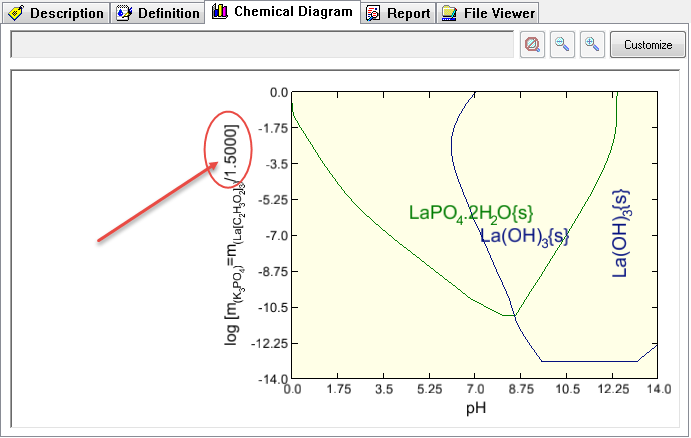
We can change the ratio of the precursor species very easily. For the second example we will use the same calculation except we will be adding 5 % more to the lanthanum acetate species. To do this click back on the Definition tab and change the inflow amount for lanthanum acetate from 0.1000 to 0.1500.
Re-Calculate and then click on the Chemical Diagram tab again.
Notice that the diagram is essentially the same. The Y axis label has changed to reflect the increased amount of the lanthanum acetate.
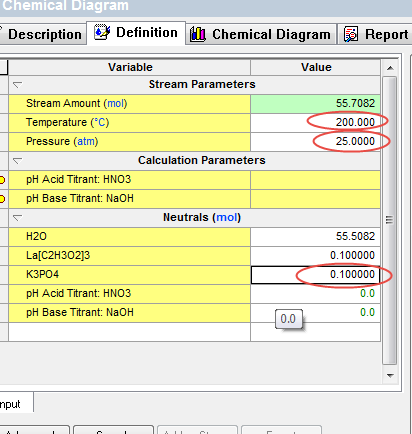
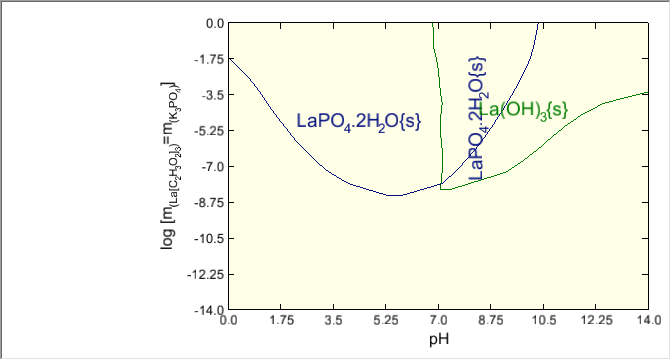
We can also run at different temperatures quite easily. Return to the Definition tab and change the temperature to 200 oC and 25 atmospheres. We have also reset the Lanthanum Acetate value back to 0.1 moles.
Re-calculate and then click on the Chemical Diagrams tab. You can see that the diagram is significantly different reflecting the change in solubility with respect to temperature.
This concludes the demonstration.
