Difference between revisions of "Using the OLI Application Loader Debugger (a/k/a OLI Application Debug Viewer)"
| Line 38: | Line 38: | ||
Here is an example of the location: | Here is an example of the location: | ||
| + | |||
| + | [[File:Debugger image 7.jpg]] | ||
| + | |||
| + | '''Click the Execute button.''' | ||
| + | |||
| + | [[File:Debugger image 8.jpg]] | ||
| + | |||
| + | The '''Verbose security tracing''' check box is when OLI requests extremely detailed data. This creates a extremely large file which may not be suitable for email. Use only as directed. | ||
| + | |||
| + | This will start the program. Exit the program. The debug viewer should have a screen similar to this displayed: | ||
| + | |||
| + | |||
| + | [[File:Debugger image 9.jpg]] | ||
| + | |||
| + | Locate the debug log file and send it to OLI or as directed. | ||
| + | |||
| + | Oli.support@olisystems.com | ||
| + | |||
| + | |||
| + | [[Category:Tips]] [[Category:Former Tips]] | ||
Revision as of 09:31, 12 July 2016
- Many processes are started when the OLI software is executed. Some of these processes are started then stopped automatically by windows, others are kept running by OLI. Start up errors may be detected in this window.
- The OLI Application Loader Debugger is supplied as a zip file. You can unzip the file into any folder including the desktop.
- This location assumes the default installation pathway. Make any changes that are appropriate.
- Locate the file and double-click the executable OLIAppDebugView.exe
- After a moment, the following window should be displayed.
In the Application Box you can specify the program to use. If you used the default settings for the installation of your OLI software then a list of available programs will be displayed in the drop down box.
Click the drop down box to find your program (in our example we are looking for OLI Analyzers 3.2)
As you can see, we have many OLI programs installed. If you have used a non-default installation path then you will have to locate the OLI program executable yourself.
To locate the program yourself (optional)
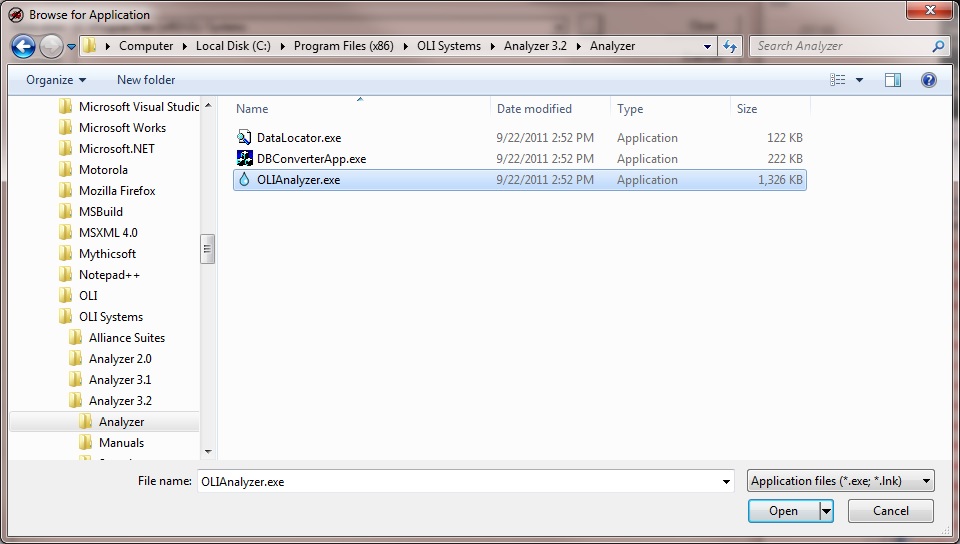
Click the … button. This will display a standard Windows open dialog.
Locate the OLI Analyzer program:
We will use a default location to store the log file. There is no browse feature for this log file you can use the default location or enter your own location. The default location will be:
C:\Users\<username>Documents\OLIDebugLog.txt
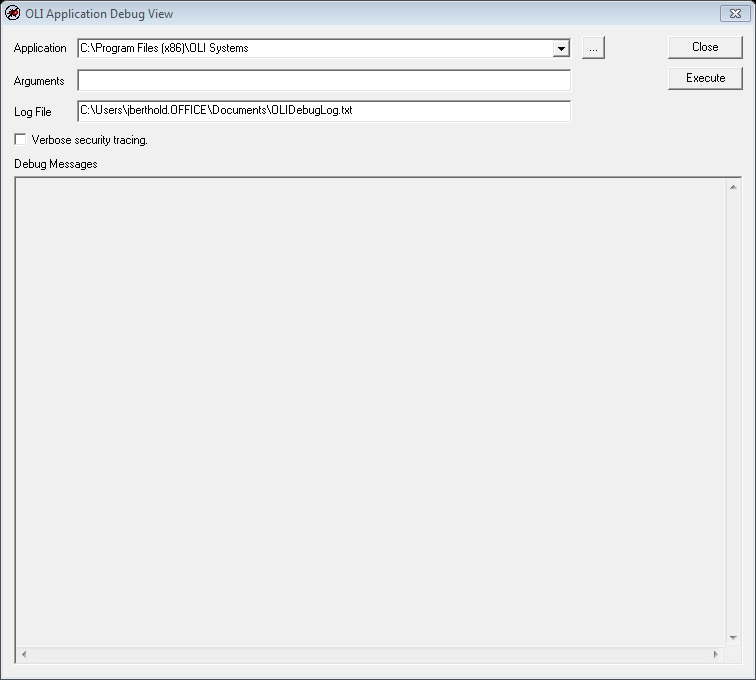
Here is an example of the location:
Click the Execute button.
The Verbose security tracing check box is when OLI requests extremely detailed data. This creates a extremely large file which may not be suitable for email. Use only as directed.
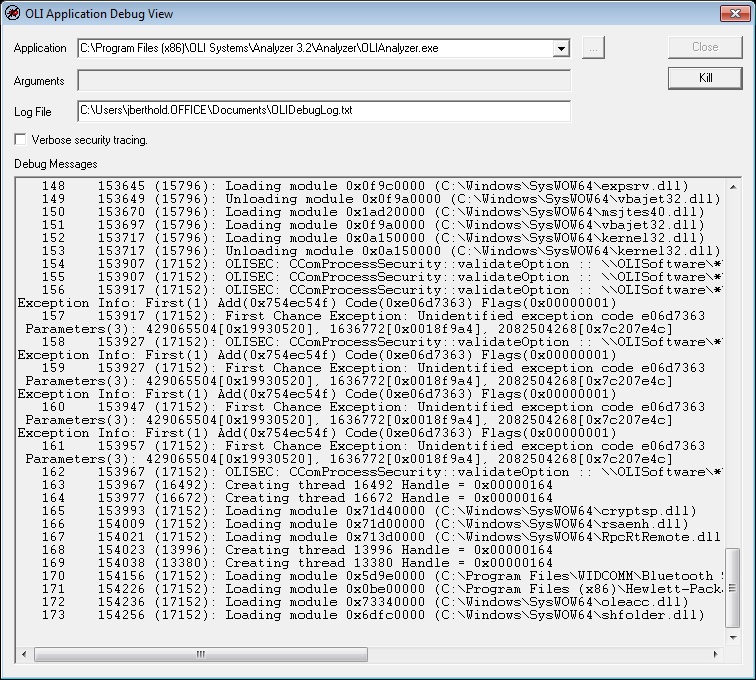
This will start the program. Exit the program. The debug viewer should have a screen similar to this displayed:
Locate the debug log file and send it to OLI or as directed.
Oli.support@olisystems.com


