Corrosion rate calculation FAQ's
1. Are the effects of a passivation layer included in the corrosion rate calculation of the general corrosion rate model?
Passivation is included in the general corrosion rate model. For a description of how the passive layer is modeled, further information can be found in the paper: “Computation of Rates of General Corrosion Using Electrochemical and Thermodynamic Models” by Anderko et al., under the section “Active-Passive Transition”, see reference below. Additionally, the "Applications of the model" section, describes how this model reproduces selected experimental data.
A. Anderko, P. McKenzie, and R. D. Young, CORROSION 2001 57:3, 202-213
2. Does the corrosion rate model include the effects of FeCO3/FeS scale formation in the corrosion rate calculation?
The corrosion rate model includes the effect of FeCO3 and FeS scales. These scales form on the surface of steel depending on environmental conditions. They are not passive films because they do not give rise to an active-passive transition (which results from the formation of oxide or non-stoichiometric oxide/hydroxide layers). However, they do affect corrosion rates by forming surface barriers and affecting both the anodic and cathodic dissolution in the active state. Their effect is most important for carbon steel and less important for corrosion-resistant alloys. A description of how the scales are modeled can be found in more detail in the paper below:
A. Anderko and R. D. Young, CORROSION/99, Paper 31
3. Does the corrosion rate model include the effects of other mineral scales, such as dolomite, minnesotaite, etc., in the corrosion rate calculation?
No, the general corrosion model includes only the effect of the scales that form as a result of electrochemical reactions between the metal and dissolved CO2 or H2S. The carbonate, sulfate or silicate scales are not included. It would be very difficult if not impossible to model the effect of such scales because their effect depends of the rate of deposition, history of formation, adherence, etc. for which there is no suitable quantitative model. The additional scales should be considered as factors that can reduce the corrosion rate, but the extent of the reduction cannot be predicted.
4. Under determined conditions, the Pourbaix diagram indicates that a passivation layer of Minnesotaite will form, yet the corrosion analysis output presents a significantly high corrosion rate. What could be the reason(s) for this? Does the software assume that the passivation layer formation is kinetically slow, and so ignore its effects?
The possible effect of minnesotaite is not included in the model for the prediction of corrosion rates. The thermodynamic prediction of the stability of this species should be considered as an indicator that the rate can be further reduced but there is no theory that would allow us to quantify such a reduction.
5. If a case involves a specific carbon steel alloy, for example L-80, which is not included in the OLI material database, what can be done to predict the corrosion rates in the OLI Corrosion Analyzer Software?
For steel L-80 and similar carbon steels, the generic carbon steel should be used. In general, it is rather difficult to quantify the differences between various carbon steel grades. However, the electrochemical mechanisms are the same. Some parameters (such as exchange current densities) may differ on various carbon steel surfaces but a consistent quantification of these differences would not be practical in view of the available literature database.
6. Is it possible to manually add alloys for corrosion rate simulations?
It is possible, but no facility is provided for a user to do it. This is done internally at OLI. For example, in the case of L-80, it is recommended to use the generic carbon steels as this should be a good approximation.
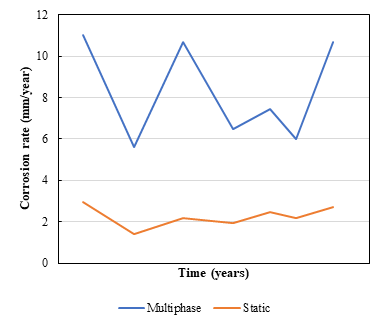
7. In a system consisting of a mix of oil and water, with a concentration of Cl-, H2S and CO2, at a predetermined temperature T and pressure P, the general corrosion rates for static flow conditions differ significantly from the general corrosion rates for multiphase flow conditions, as is illustrated in Figure 1. Why are these calculated corrosion rates different?
OLI has extensively tested the general corrosion rate model predictions against experimental laboratory data. In fact, experimental laboratory data are particularly abundant for static conditions and for well-defined single-phase flow conditions. Thus, predictions can be considered more trustworthy for static and single-phase flow conditions than for multiphase flow conditions. We believe that the methodologically correct approach is to compare our model directly against experimental data.
In general, large differences between static and multiphase flow conditions such as the ones shown in Figure 1 are to be expected when the metal is not passive (and carbon steel is certainly not passive in typical CO2/H2S environments). Then, mass transport of reacting species (such as protons (H+), carbonic acid molecules (H2CO3) and hydrogen sulfide (H2S) is numerically important in the electrochemical reactions.
8. Does changing the dimension of a pipe’s diameter change the estimation of the corrosion rate?
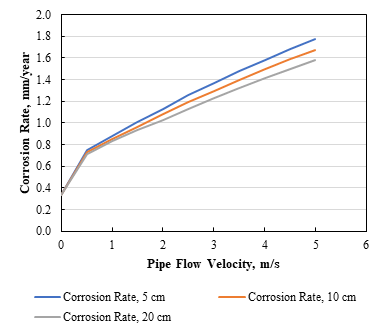
The default pipe diameter in the software is 10 cm which is 3.937 inches. This can be changed as required. We have performed a series of corrosion rate calculations at various pipe diameters, and in Figure 2, it can be seen a change in rate. As the diameter of the pipe increases, the corrosion rate decreases.
9. What are the differences between the static, pipe flow, approximate multiphase flow, and shear rate calculations? How are the corrosion rates estimated based on these different types of flow?
The fundamentals of our model are described in the two attached “General corrosion” papers:
A. Anderko, P. McKenzie, and R. D. Young, CORROSION 2001 57:3, 202-213
A. Anderko and R. D. Young, CORROSION/99, Paper 31
These papers deal with the electrochemical aspects of the model and with single-phase flow. In short, the flow effects enter the model through the mass transfer coefficient. The mass transfer coefficient determines the flow effects on interfacial reactions because the flux of the species to or from the surface is proportional to the mass transfer coefficient times the difference between the bulk phase concentration of electrochemically active species and their concentration at the corroding interface. For single-phase flow, there are well-established correlations that link the mass transfer coefficient with properties such as diffusivity, viscosity and density (all of which being calculated by the OLI Engine). There are separate correlations for single-phase pipe flow, rotating disk, rotating cylinder etc.
For multiphase flow, the situation is more complicated. The rigorous way to calculate the effect of multiphase flow is to link the mass transfer coefficient to the shear stress and to calculate the shear stress from multiphase flow software. The following paper Extension of the Corrosion Analyzer to Multiphase Flow Conditions, describes how this is done. This would be the best and most rigorous way to calculate the multiphase flow effects, but we are aware that many users of our software do not have a ready access to fluid flow software. Therefore, we provide an approximate multiphase model, in which the shear stress is calculated from the Norsok correlation, which in turn uses earlier published work, as is described in the Norsok Standard, (CO2 corrosion rate calculation model - Norsok Standard). So, while the link between the mass transfer coefficient and shear stress is rigorous, the prediction of the shear stress for multiphase systems is only approximate.
10. In a O2 containing environment, does corrosion of carbon steel decrease as the pipe diameter increase?
The limiting current density is proportional to the mass transfer coefficient. The mass transfer coefficient is obtained from the following equation:
Sh = 0.0165 Re0.86 Sc0.33
The pipe diameter d enters into both the Sherwood number (Sh) and the Reynolds number (Re) but with different exponents:
Sh = km d / D
Re = V d / nu
So, calculating km from the correlation, the pipe diameter will be d0.14 in the denominator. This means that the mass transfer coefficient will decrease with an increase in the pipe diameter.
This means that the smaller the diameter, the greater the turbulence and, consequently, the greater the mass transfer near the wall (this of course would not apply to very thin capillary tubes, but it does apply to “normal” pipes).

