Creating and using Analyzer Plot Templates
Analyzer Plot
In many cases, a use will need to re-use a plot several times. For each calculation it can be tedious to click on the same options time-and-time again. Fortunately there is an option to save the layout of a plot as a template.
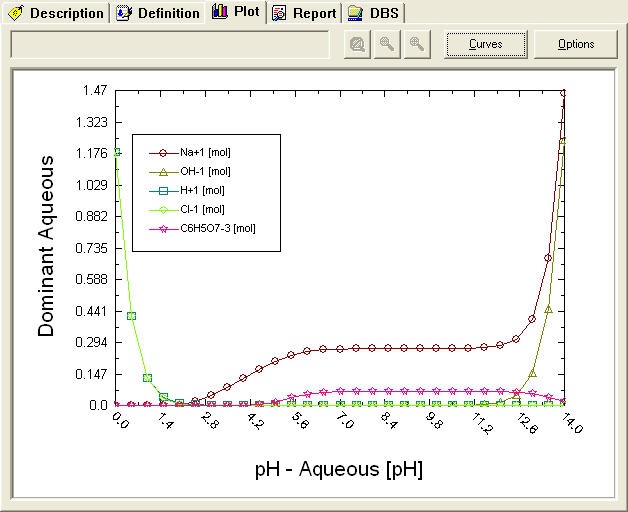
In this example we have performed a pH titration curve on citric acid. The default plot is displayed below.
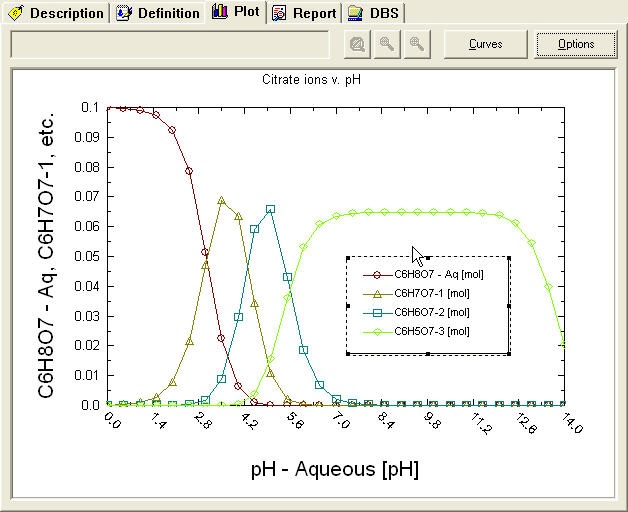
We have used the standard plot options to modify our display to show the amount of individual ions as well as add a title.
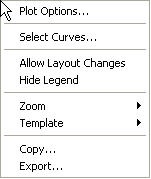
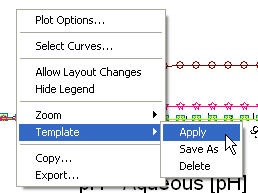
To save this layout, we need to right-click anywhere on the plot area. This will display a pop-up menu.
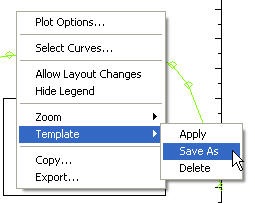
There are many options here and we encourage the user to experiment with these options. Select Template from this menu.
Then select Save As from the sub-menu
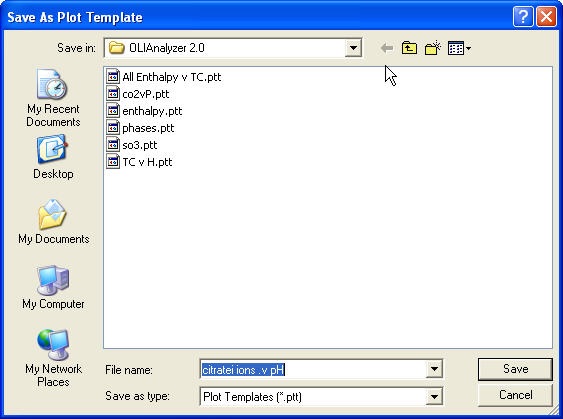
This displays a standard windows Save As… dialog. Enter a name for your template. All OLI templates will be saved with the file extension ptt. Click save when done.
By default, these files are saved in the OLI configuration folder but you may save them anywhere on your computer.
To use a stored template, right-click anywhere on the plot area.
Select Template and then Apply from the pop-up menus.
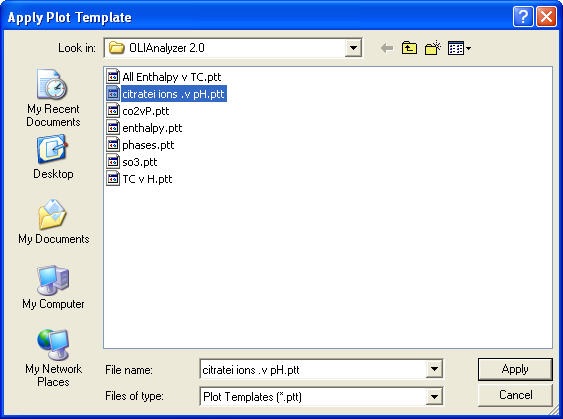
From the standard windows open dialog, select the template you wish to use. All OLI templates are stored with the ptt file extension. If you open a template that does not have the corresponding values in the plot then the display will show no values. In this example we are opening the previously saved template for citric acid ions.
Click Apply when done.
The layout is now displayed.
This was former Tip78.
