Exporting plot data from Analyzer Plots
Overview
The OLI Studio can provide a wealth of information about a chemical system. Sometimes you are interested in only a small portion of the data and do not want to sort through all the output. The plot options can easily reduce the massive amount of data to a smaller, manageable amount. In this guide we will show you a typical procedure to accomplish this task.
Example
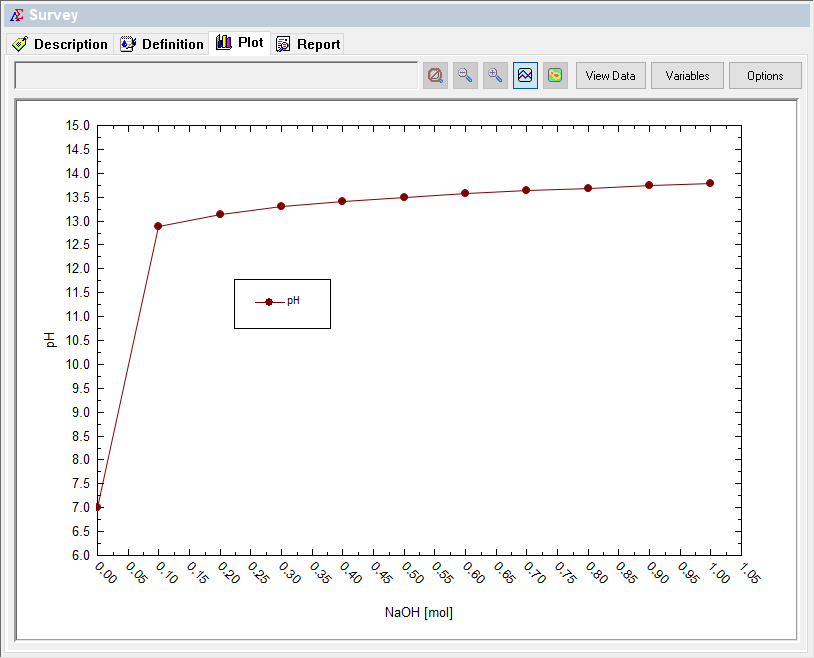
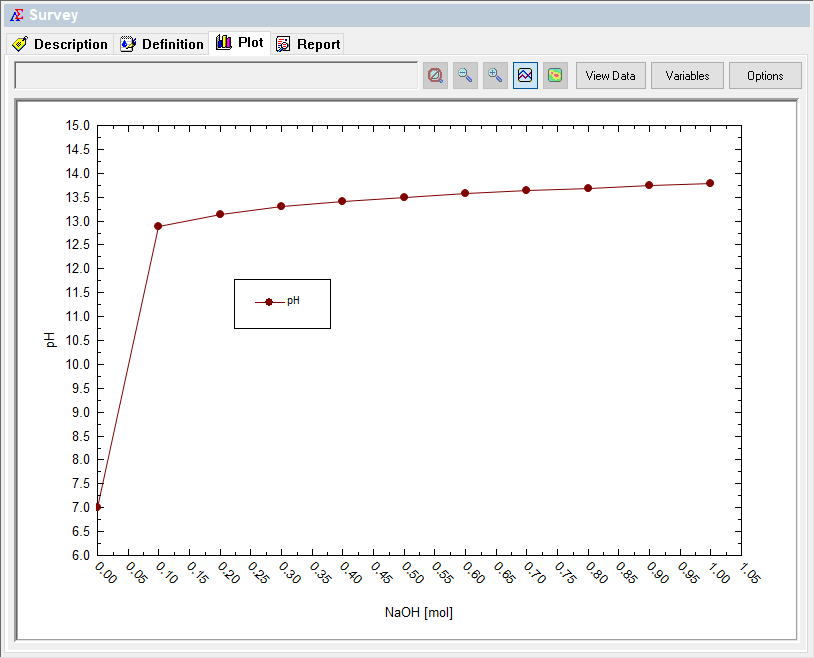
In this example we are plotting the pH versus the amount of sodium hydroxide in the solution. This technique will work for any plotted variable. You will need to specify the units you want to use since they can not be automatically changed once the data is exported. Also, apply any formatting and title changes you wish at this time.
To start the export, click the View Data button.
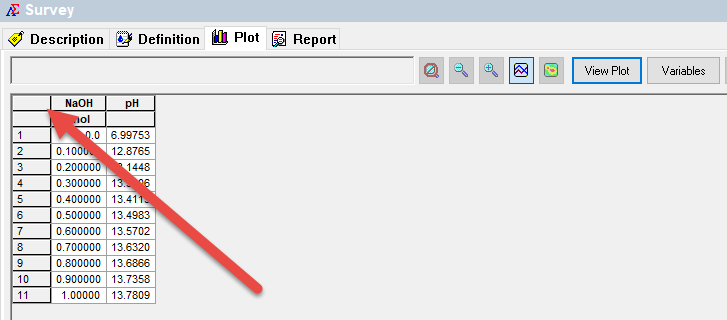
This will display the data for the plot.
Click the box in the upper left-hand corner
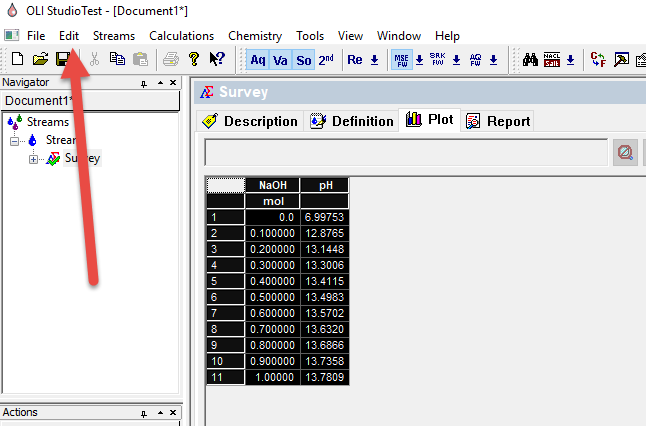
This will select all the data in the grid. Then click the Edit button from the menu
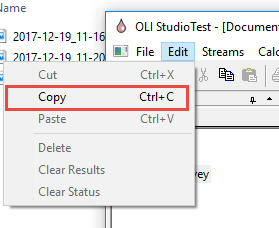
Select Copy from the drop-down menu
This places all the selected data into the Clip-Board paste buffer.
Start Excel
Next start your spreadsheet program. The example here uses Microsoft Excel 2016.
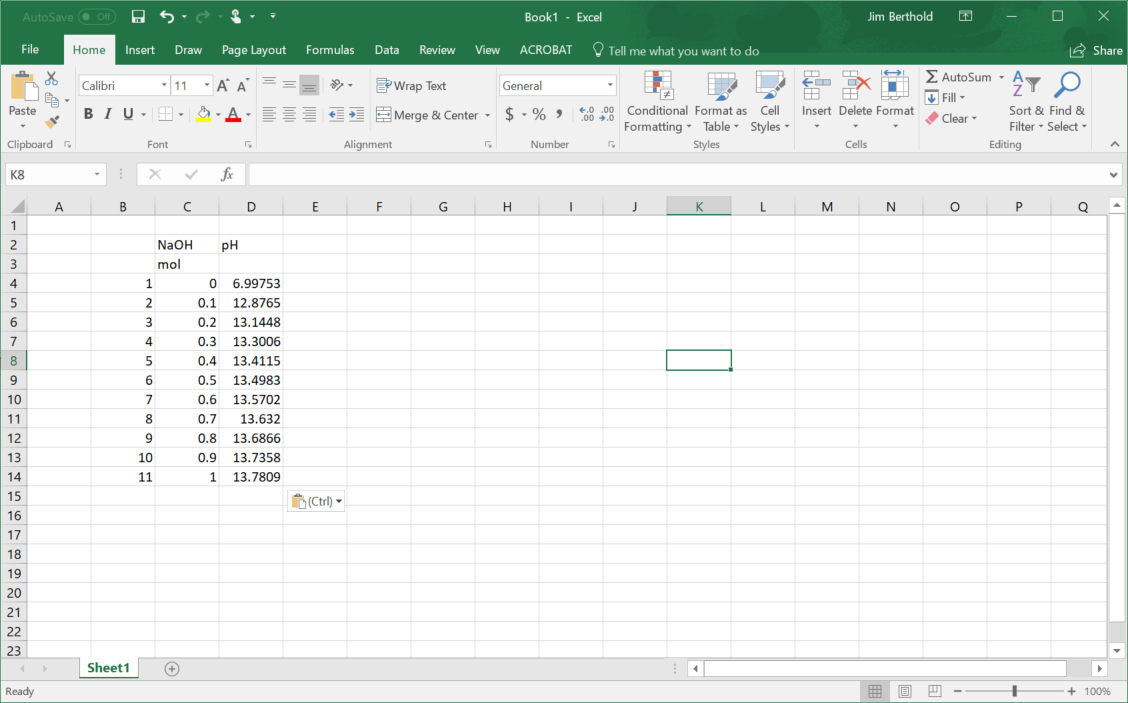
Since the data is in the paste buffer you can simply use the control-V paste function to paste the data.
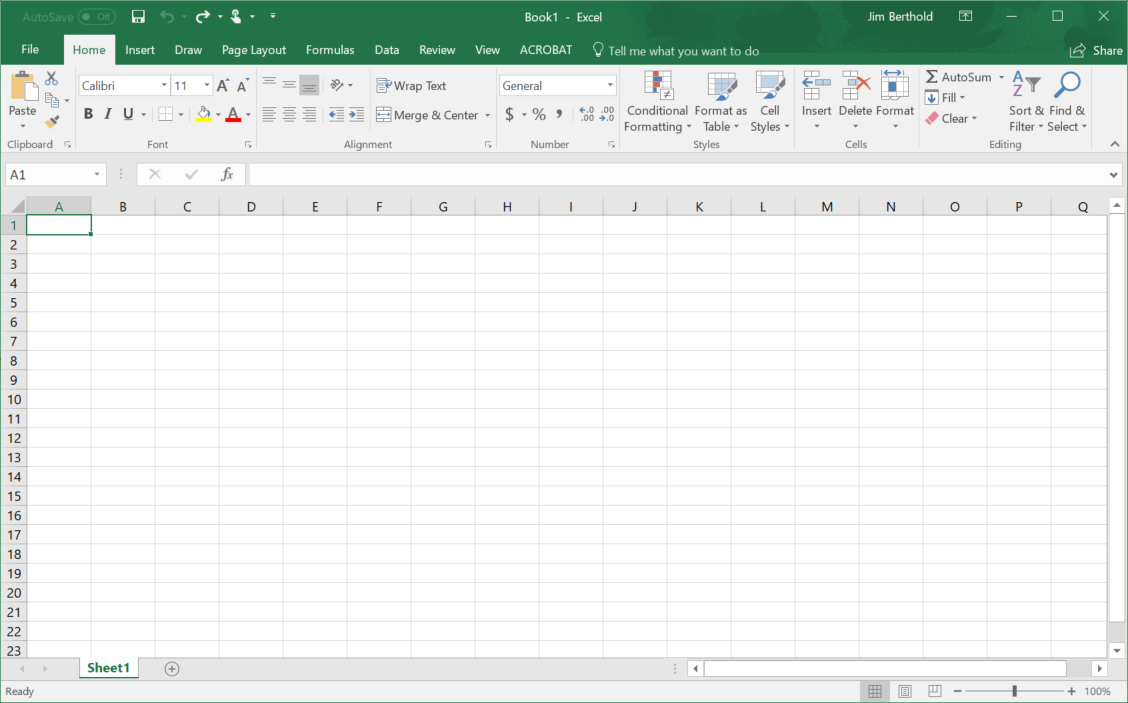
Here is Excel before the operation
Select the cell where you want the data to be displayed and then press control-v
At this point you all the standard Excel functions are available. It is important to note that the connection to OLI Studio is not maintained. If you need update Excel with new data you need to repeat these steps.
Exporting the plot to a graphics image file
Supported graphics images
The following file types are supported in the graphics export procedure:
BMP - Bitmapped files JPG - JPEG files PNG - Portable graphic files
Export Procedure:
Display the plot you wish to export
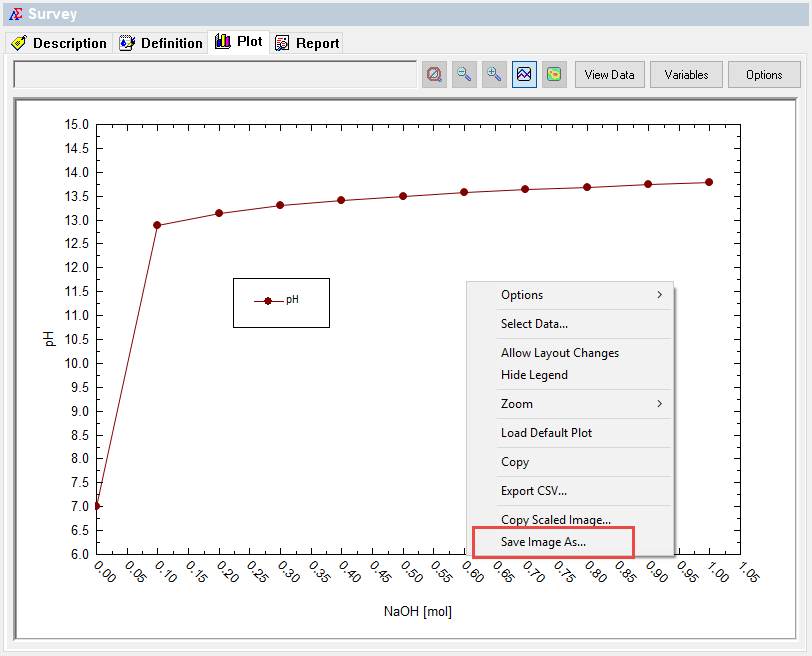
Right-click anywhere on the plot:
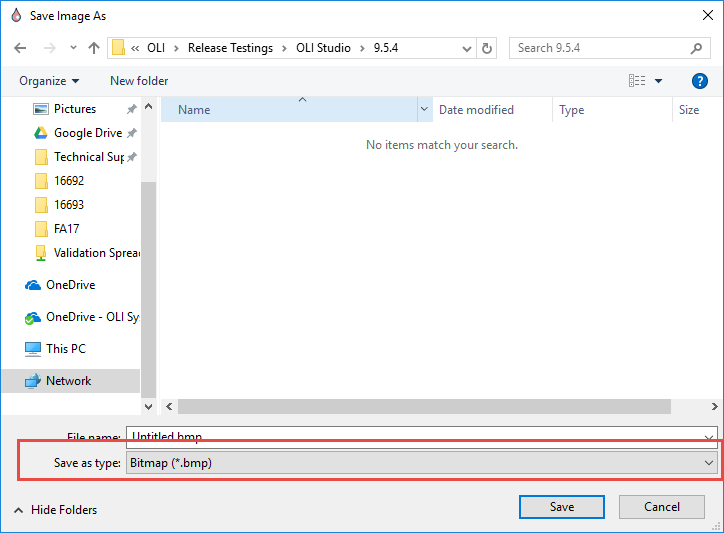
Select Save Image As...
This dialog is similar to any windows file management window.
Specify the Save as type: file type. Bitmaps tend to have the highest resolution but are the largest files, JPEG files are more compressible but the higher the compression the greater the degradation of the image. PNG files are easily compressed and have little loss but are not supported by all graphics programs.
Switch to your working folder then specify the name of your file.
Click the Save button.
