Mass Transfer Towers
Contents
- 1 Mass Transfer Towers Overview
- 2 Some Frequently Asked Questions about OLI's Mass Transfer Columns
- 2.1 What are the default input data currently used with each tray type?
- 2.2 Does OLI Provide detailed packed column reports?
- 2.3 Other major simulators have the functionality in which calculated pressure drop is automatically reflected in the column pressure drop. Can ESP model have the same?
- 2.4 Stage Height Question
Mass Transfer Towers Overview
To select a mass transfer tower as a model, you select multistage blocks and then select absorber or stripper. The program will then ask if you want a mass transfer tower.
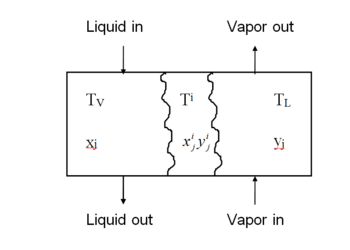
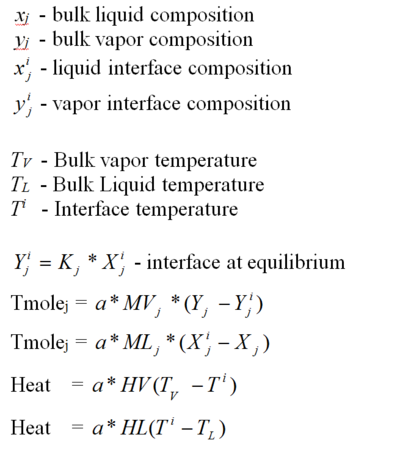
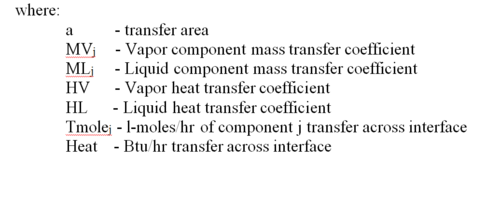
The mass and heat transfer coefficients along with the interfacial area are entered via the parameters option on the action bar. At least one value should be entered for the vapor and liquid overall mass transfer coefficient. Values for stages not entered are interpolated. If component mass transfer coefficients are desired, answer yes when the option is displayed. The values entered for component mass transfer will override the overall values entered, any component not specified will have the value entered for the overall coefficient.
The larger the mass and heat transfer coefficient, the closer the tower will be to equilibrium conditions. For a gas-liquid tower the major resistance is normally on the mass transfer coefficient on the vapor side of the interface. In such a case the liquid side coefficient is set large and the vapor side coefficient adjusted to match experimental results. The heat transfer coefficients are normally set large.
Column Stage
Some Frequently Asked Questions about OLI's Mass Transfer Columns
Many of the packed column values are taken from the following references:
Billet, R. and Schultes, M. Chem. Eng. Technol. 14 (1991) 89-95
Billet, R. and Schultes, M. Chem. Eng. Technol. 16 (1993) 1-9
Billet, R. and Schultes, M. Chem. Eng. Technol. 18 (1995) 371 - 379
What are the default input data currently used with each tray type?
Sieve Tray
There are four input parameters for the Sieve Tray
Sieve Tray: Four input parameters
1. Column diameter (coldia): If not entered, ESP calculates diameter using Reference 1.
su = 0.65d0/dsqrt(denv*0.062428d0) calcdiam = dsqrt(av*4.0d0/(pi*su))
where, su = Superficial gas velocity, m/sec denv = Vapor density, kg/m3 av = Vapor flow rate, m3/sec 0.65 = Gas phase kintetic-energy term (F factor), uniteless calcdiam = calculated diameter, m Please note, unit conversions are not shown in the equations.
Reference 1: Perry’s Chemical Engineer’s handbook, 6th Edition, pages 18-6.
2. Weir height (hweir):
If not entered, hweir = 1.0 inch.
3. Clear liquid height (hl):
If not entered, ESP calculates the clear liquid height or the height of crest over wire (hl) using Reference 2.
hl = 664.d0*(al/lw)**(0.667)*1.0d-3
where al = Liquid flow rate, m3/sec lw = Weir length, m hl = Clear liquid height, m
The weir length (lw) is calculated from a correlation using Reference 2.
lw = exp(log(al/6.309d-5)/25)/2.5d0 * 0.3048d0
Reference 2: Perry’s Chemical Engineer’s handbook, 6th Edition, pages 18-10,11.
4. Froth height (hf):
If not entered, hf = 2.0*hl.
For sieve tray, the weir length information is accounted in our model. Weir height is the only parameter set as default unless it is a user input. Hole diameter and/or arrangements are not required in the currently implemented model, however, current model uses above information plus diffusivity, Schimdt number, porosity of froth and other readily available data to calculate interfacial area per unit froth volume and finally mass transfer coefficients in the gas and liquid phase. More details about OLI’s Sieve tray can be found in Reference 3.
Reference 3: Moniuk, W., Bekassy-Molnar, E., Mustafa, H. and Pohorecki, R., “Absorption of carbon dioxide into sodium hydroxide solutions in a sieve plate column”, Hungarian Journal of Industrial Chemistry, 17 (1989), 93-105.
Valve Tray:
There are two input paramters for valve trays
1. Column diameter (coldia):
If not entered, ESP calculates diameter using Reference 1 as shown in Item 1 for Sieve Tray.
2. Weir height (hweir):
If not entered, hweir = 1.0 inch.
No other information is required for the currently implemented model. The valve tray model uses flow rates, Reynolds number, Schimdt number and above two tray hydraulics data to calculate interfacial area and finally mass transfer coefficients. Details of the OLI’s Valve tray model can be found in Reference 4.
Reference 4: Scheffe, R.D. and Weiland, R.H., “Mass-Transfer Characteristics of Valve Trays”, Industrial & Engineering Chemistry Research 26 (1987), 228-236.
Bubble Cap
There is only one input parameters
1. Column diameter (coldia):
If not entered, ESP calculates diameter using Reference 1 as shown in Item 1 for Sieve Tray.
No other hydraulic information is required for the currently implemented model. The model uses velocity of gas/liquid, density and surface tension to calculate gas holdup using a correlation which is a function of Bond number, Galileo number and Froude number. The model shows that the effect of the diameter of the single gas inlet orifice to the column diameter can be ruled out. The model then calculates interfacial area and mass transfer coefficients using above information and calculated Schimdt number and Sherwood number. Details of the OLI’s bubble column model can be found in Reference 5.
Reference 5: Akita, K. and Yoshida, F., “Gas holdup and volumetric mass transfer coefficient in bubble columns”, Industrial & Engineering Chemistry Process Design & Development, 12(1) (1973), 76-80.
Does OLI Provide detailed packed column reports?
Yes, OLI does provide detailed reports.
Sieve Tray
ESP currently shows the Sieve Tray Report which is accessible through Packed Column Report. It is apparent that accessing Sieve Tray Report through the Packed Column Report may not be a good idea, but we have decided to change the entry name in the column profiles (i.e., Packing/Tray Report). Currently, we report the column diameter at the end of the Sieve Tray Report, however, area can be added too.
Valve Tray
ESP shows the Valve Tray Report which is accessible through Packed Column Report.
Bubble Cap Tray
ESP shows the Bubble Cap Report which is accessible through Packed Column Report.
Other major simulators have the functionality in which calculated pressure drop is automatically reflected in the column pressure drop. Can ESP model have the same?
No, Pressure profile is a user input parameter for OLI’s column and is not an estimate. ESP does not recalculate the pressure profile or pressure drop in the column, and apply back to column and converge. ESP only interpolates to match the user provided pressure profiles.
Stage Height Question
Question: Regarding the stage height: how is this defined internally? With a 10m stage height, does this mean that the total column height is 10m * 30 stages = 300m? Or is each stage height equal to the stage height (10m) / 30 = 0.333m?
Answer: In terms of stage height, there are various choices available to users. Each stage has its own height or stage height is per stage.
Here are the different scenarios:
(a) When only the stage height is provided by the user (without the column diameter): In this case, OLI utilizes the user-provided stage height and calculates the column diameter accordingly.
(b) When only the column diameter is given by the user (without the stage height): In this situation, OLI uses the provided column diameter and assumes that the stage height is half of the column diameter. If the calculation yields a stage height outside the range of 0.2m to 1m, the stage height is adjusted to fall within this lower and upper bound.
(c) When no values are given (neither the column diameter nor the stage height): OLI calculates the column diameter and employs the strategy outlined in option c to determine the stage height.
(d) When both the column diameter and stage height are provided: OLI utilizes the given stage height and matches it with the provided column diameter.
Given the information above, if users are aware that their column has a stage height of 10m and they input this value into OLI, OLI will use 10m as the stage height without modification. Consequently, a column with 30 stages, each measuring 10m in height, would result in a total column height of 300m.
This was OLITips21


