Creating and using Analyzer Plot Templates
Analyzer Plot
In many cases, a use will need to re-use a plot several times. For each calculation it can be tedious to click on the same options time-and-time again. Fortunately there is an option to save the layout of a plot as a template.
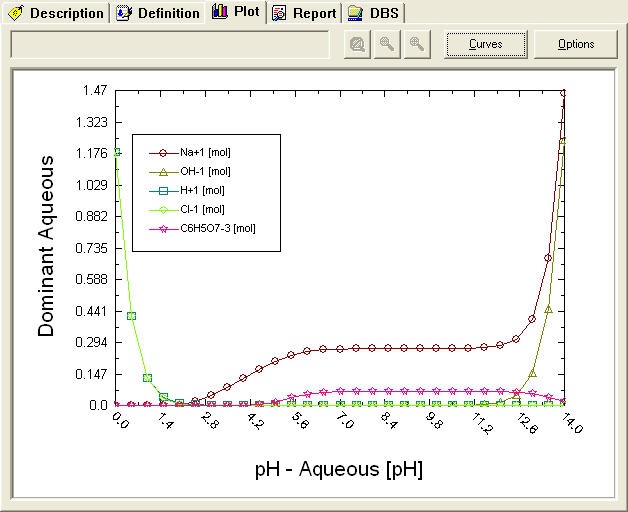
In this example we have performed a pH titration curve on citric acid. The default plot is displayed below.
