Creating and using Analyzer Plot Templates
Analyzer Plot
In many cases, a use will need to re-use a plot several times. For each calculation it can be tedious to click on the same options time-and-time again. Fortunately there is an option to save the layout of a plot as a template.
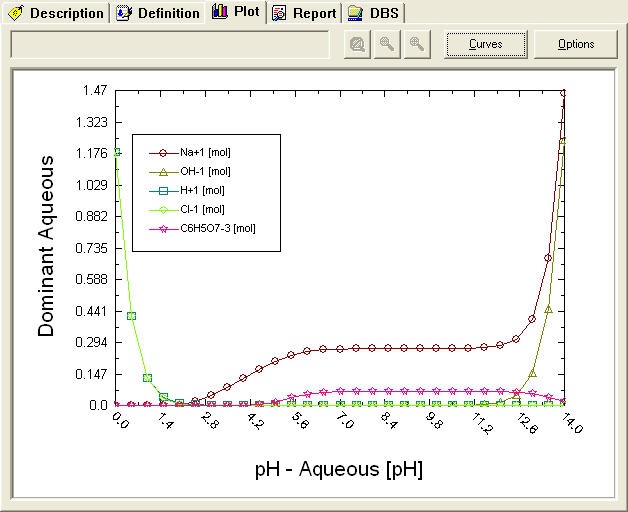
In this example we have performed a pH titration curve on citric acid. The default plot is displayed below.
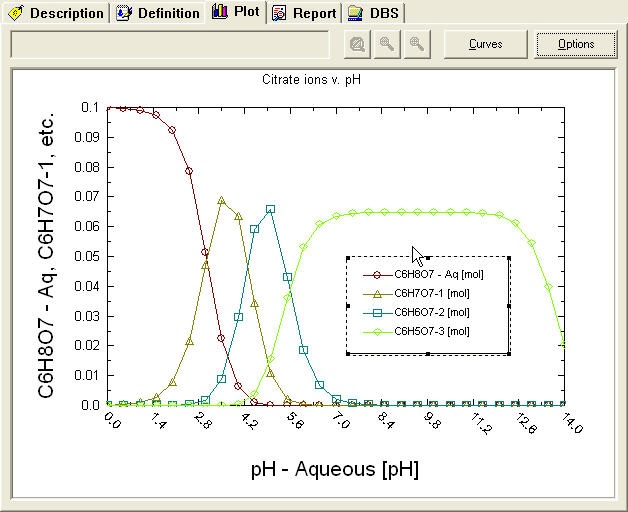
We have used the standard plot options to modify our display to show the amount of individual ions as well as add a title.
To save this layout, we need to right-click anywhere on the plot area. This will display a pop-up menu.

